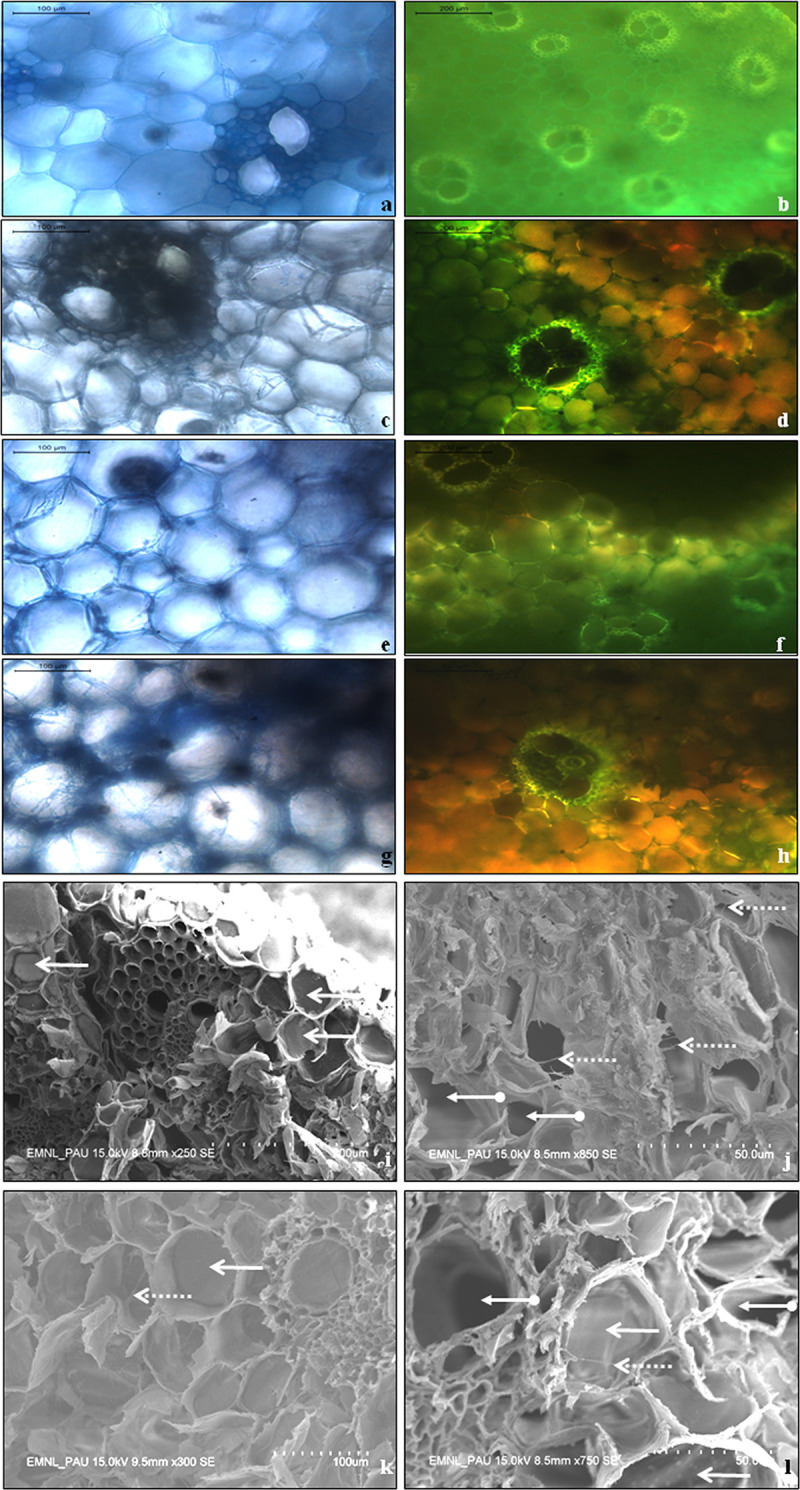
Fig 5. Microscopy of sugarcane stalk tissue and parenchyma cells.

Optical microscopy and fluorescence imaging of sections from stalk tissue of non-inoculated non-transgenic sugarcane exhibiting (a) clear middle lamella (b) normal vascular bundles; Inoculated non-transgenic tissues displaying (c) fungal hyphae ramifying through the middle lamella (d) inflated vascular tissues showing loss of green autofluorescence; The transgenic plant Chit 3–13 inoculated with CF08 exhibiting (e) fewer hyphae in the middle lamella and inside the cells (f) normal green autofluorescence; The transgenic plant Chit 3–13 inoculated with CF13 depicting (g) fungal hyphae present in middle lamella as well as inside the cells (h) loss of normal autofluorescence. Scanning electron microscopy of sugarcane stalk parenchyma cells(i) The cells of non-transgenic non-inoculated plant, bold arrows indicate the characteristic turgid sucrose-filled cells(j) The cells of non-transgenic plant inoculated with CF08, dotted arrows indicate presence of pathogen hyphae and arrows with circular end show sucrose depleted cells (k) The cells of transgenic plant Chit 3–13 inoculated with CF08, bold arrows indicate turgid cells and dotted arrows depict presence of pathogen hyphae (l) The cells of Chit 3–13 inoculated with CF13, bold arrows indicated sucrose-filled turgid cells, dotted arrow represents presence of pathogen hyphae and arrow with circular end shows the sucrose depleted cell.
