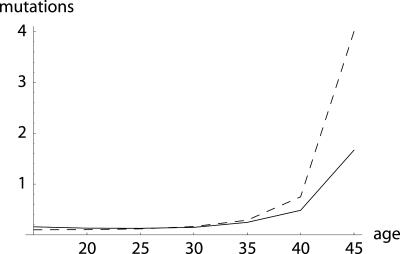
Fig. 4.
Equilibrium number of mutations: additive (dashed line) and proportional (solid line). The example is based on female mortality, as given in the Swedish life table for 1778–1782, for seven 5-year age groups, beginning at age 15. Because the Swedish population was growing at that time, I normalized reproduction to ensure R = 1.00. I consider a deleterious mutation that reduces remaining reproduction at any age by ≈1%, either in an additive or in a proportional way, i.e., δ = 0.01 in Eq. 21a and δ = 0.7 in Eq. 21b, and I assume a mutation pressure of ν = 0.001. The difference between the additive and proportional case increases at higher ages, as levels of remaining reproduction decline. A slight decrease in the equilibrium number of mutations from the first to the second age group can be observed.

