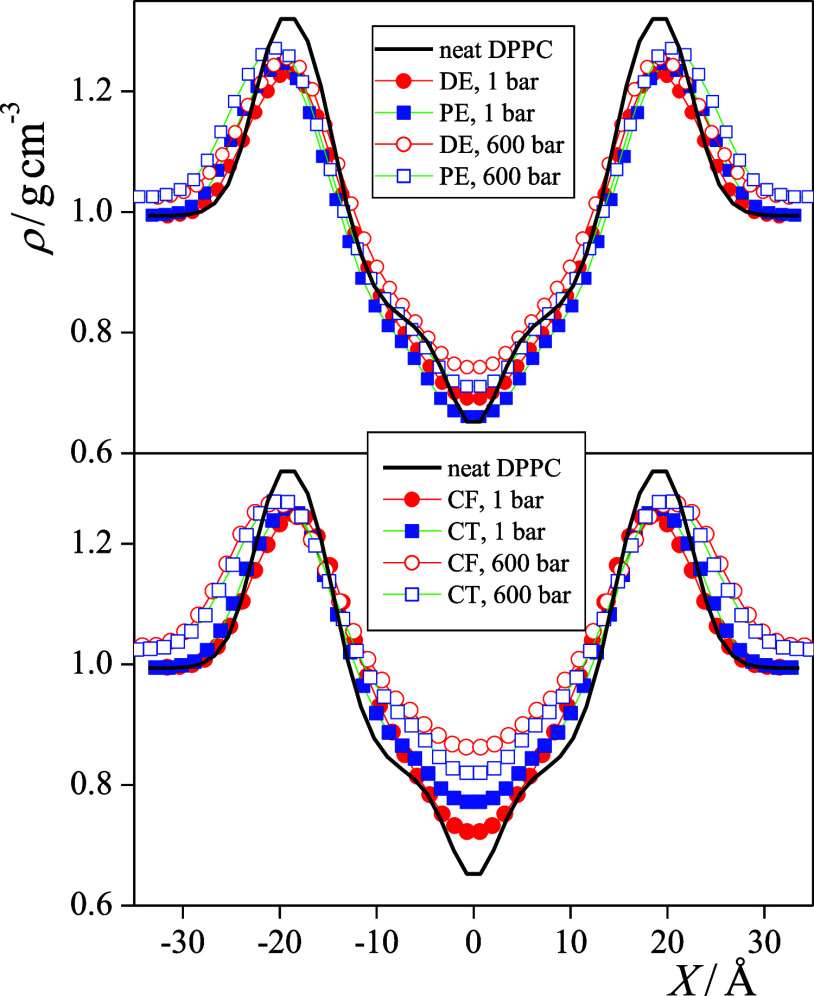
Figure 3.
Mass density profiles of the membranes simulated along their normal axis, X. Black solid line: neat DPPC membrane without any dissolved molecule (simulated at 1 bar), red circles: membranes with anesthetics, and blue squares: membranes with non-anesthetics. Filled and open symbols correspond to the systems at 1 and 600 bar, respectively. Top panel: membranes containing the DE/PE anesthetic/non-anesthetic pair; bottom panel: membranes containing the CF/CT anesthetic/non-anesthetic pair. The profiles shown are averaged over the two leaflets of the membrane.

