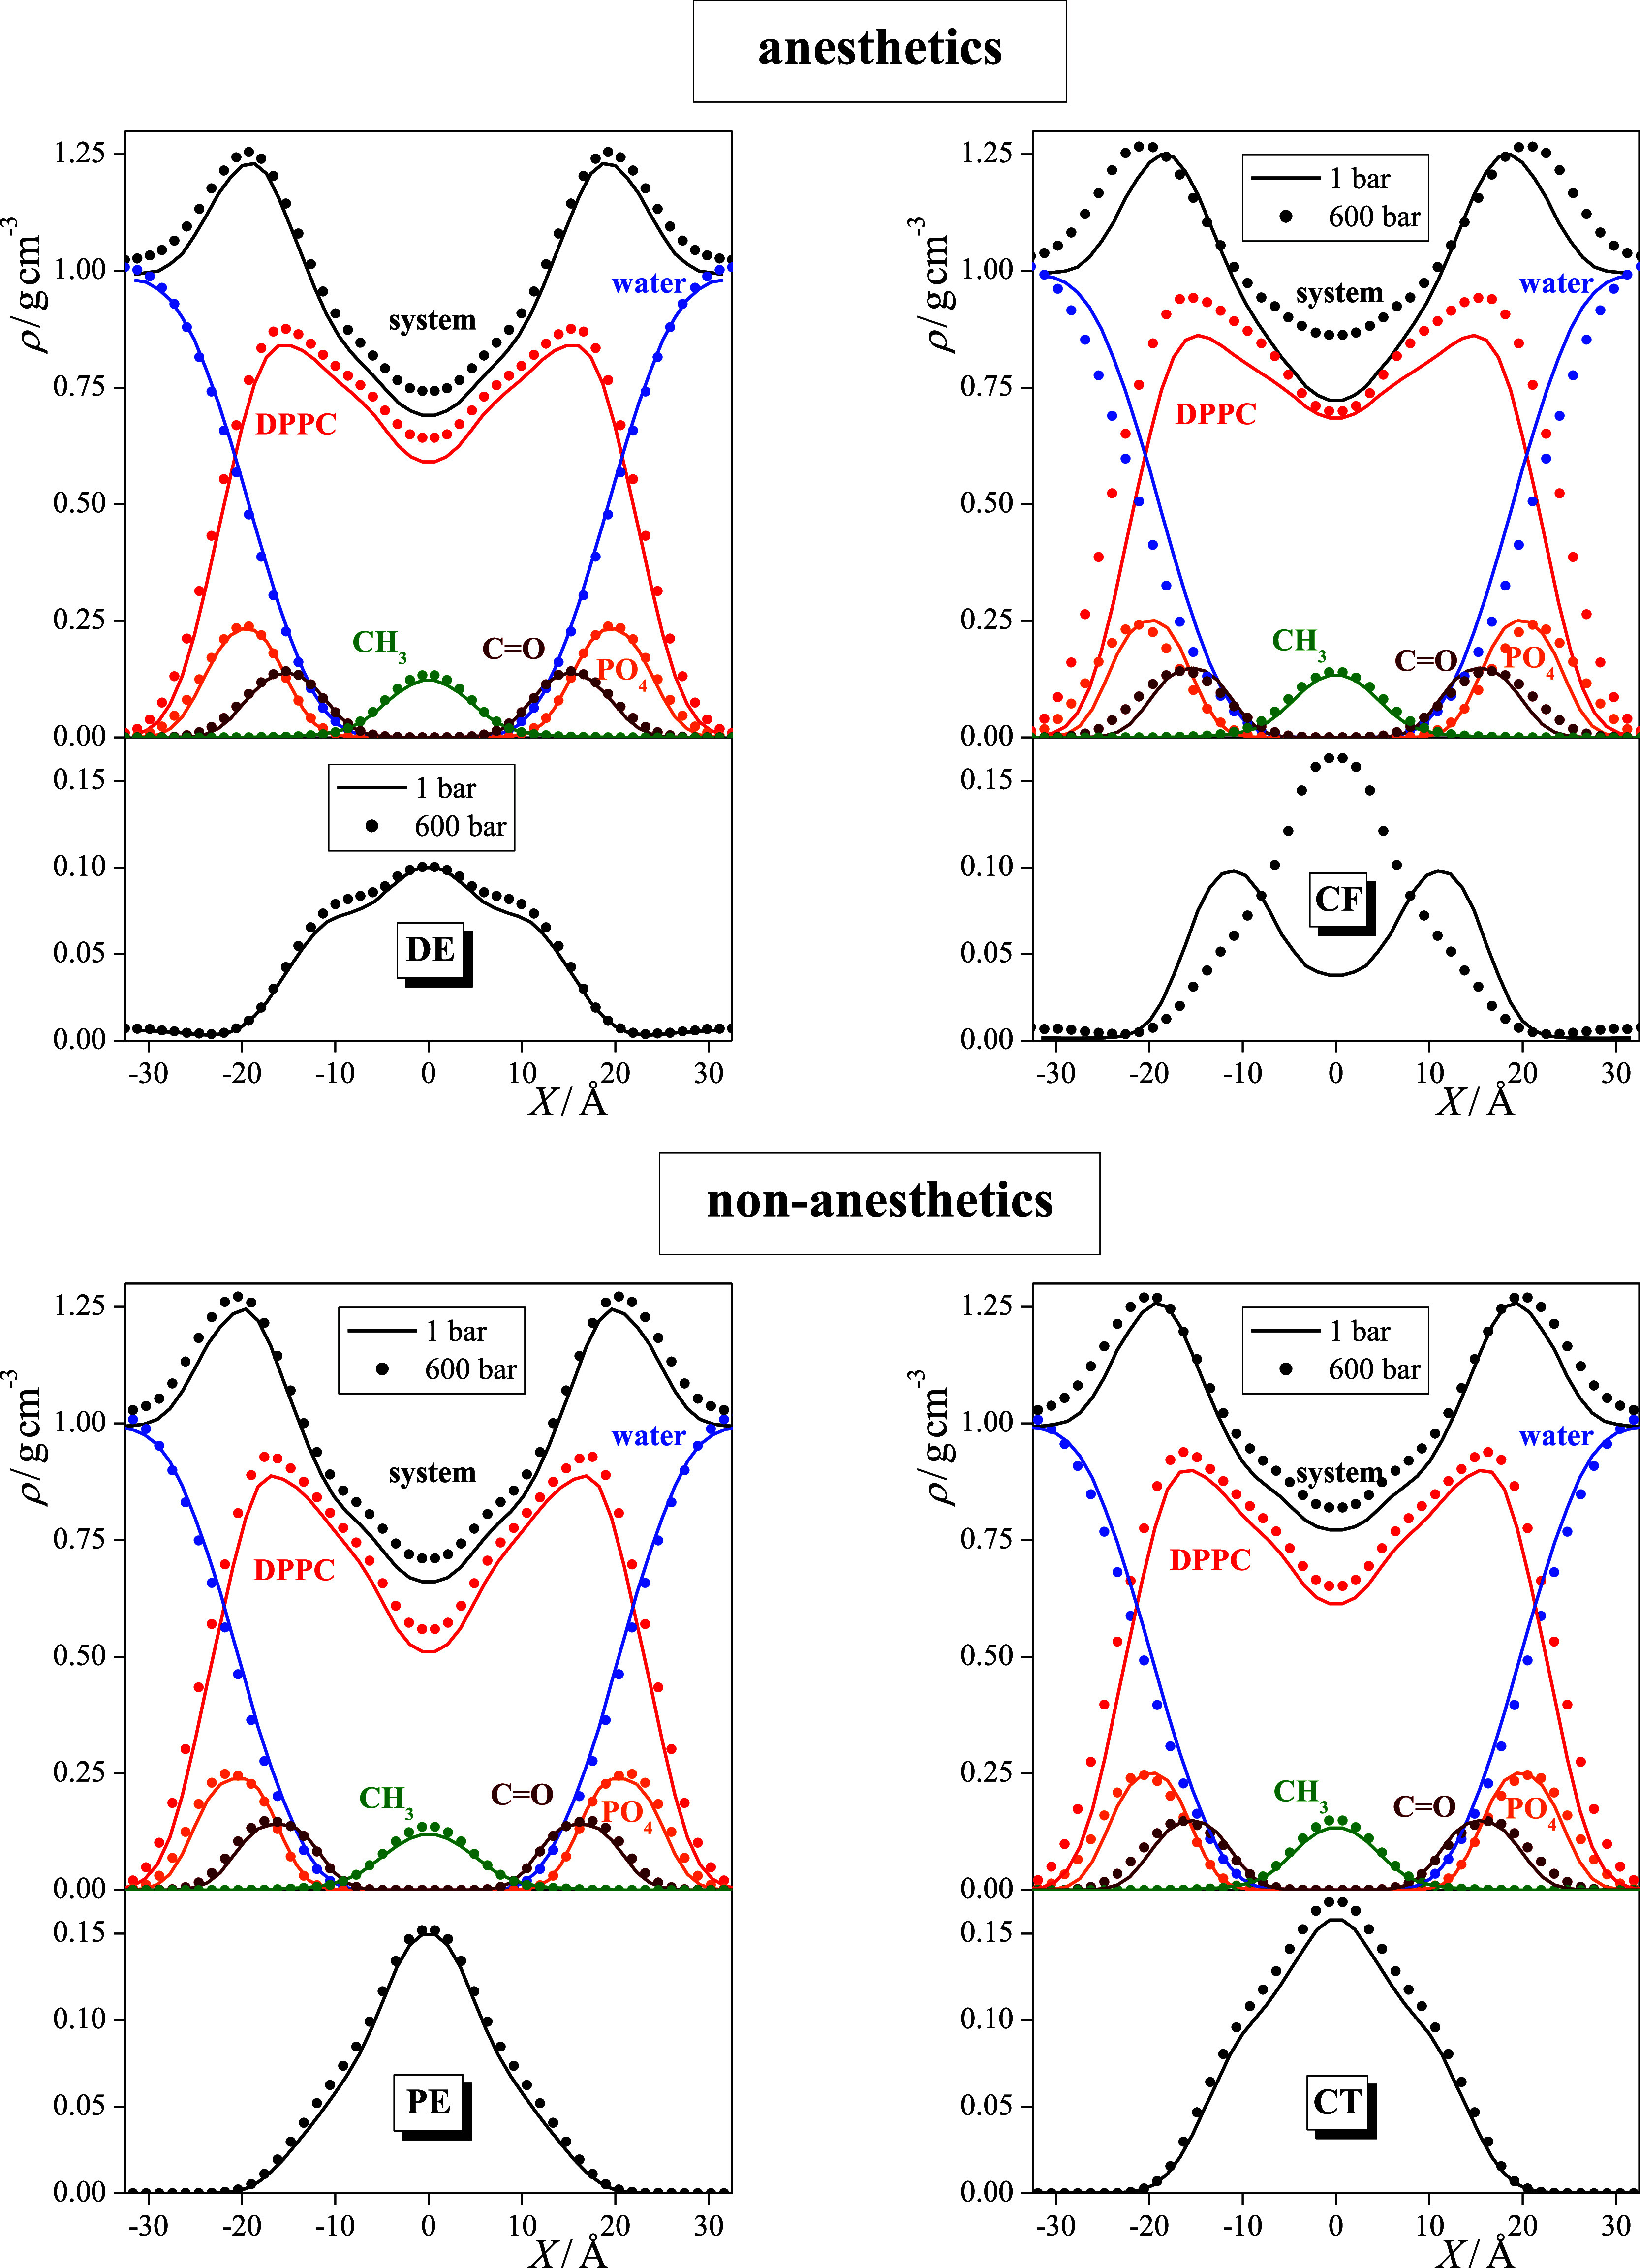
Figure 4.

Mass density profiles of the membranes, containing dissolved DE (top left), PE (bottom left), CF (top right), and CT (bottom right) molecules, along the membrane normal axis, X, and contributions of various molecules and groups to these profiles. Top panels: black: entire system, blue: water molecules, red: DPPC molecules, orange: PO4 groups, brown: esteric C=O groups, and green: chain terminal CH3 groups. Bottom panel: profile of the dissolved anesthetic or non-anesthetic molecules. Solid lines and symbols correspond to systems at 1 bar and 600 bar, respectively. The profiles shown are averaged over the two leaflets of the membrane.
