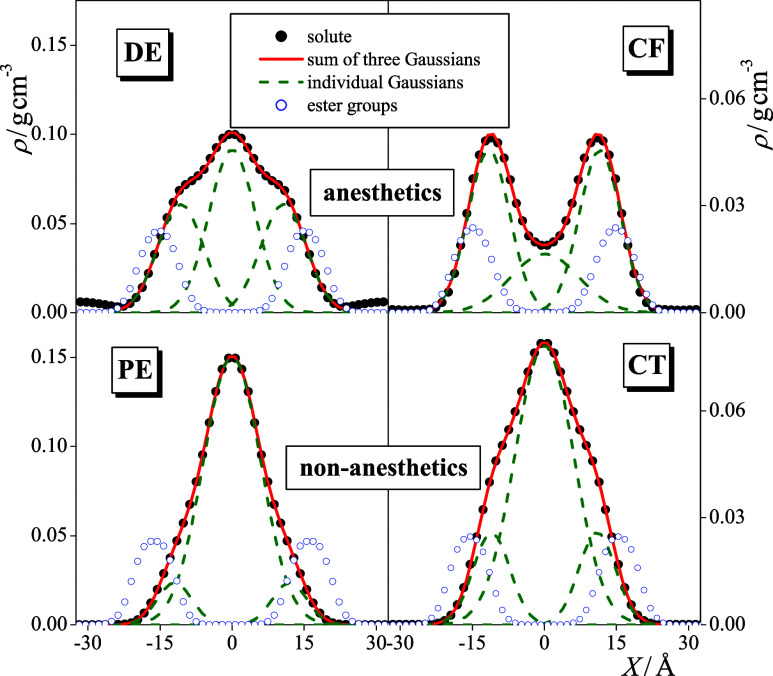
Figure 5.
Mass density profiles of the dissolved DE (top left), PE (bottom left), CF (top right), and CT (bottom right) molecules along the membrane normal axis, X, as obtained at 1 bar (black filled circles), together with their fits with the sum of 3 Gaussian functions (red solid lines) and the individual Gaussians (green dashed lines). The density profile of the esteric C=O groups are also shown for reference (blue open circles). Scales at the left and right sides correspond to the densities of the dissolved molecules and fitted Gaussians and to that of the esteric C=O groups, respectively. The profiles shown are averaged over the two leaflets of the membrane.

