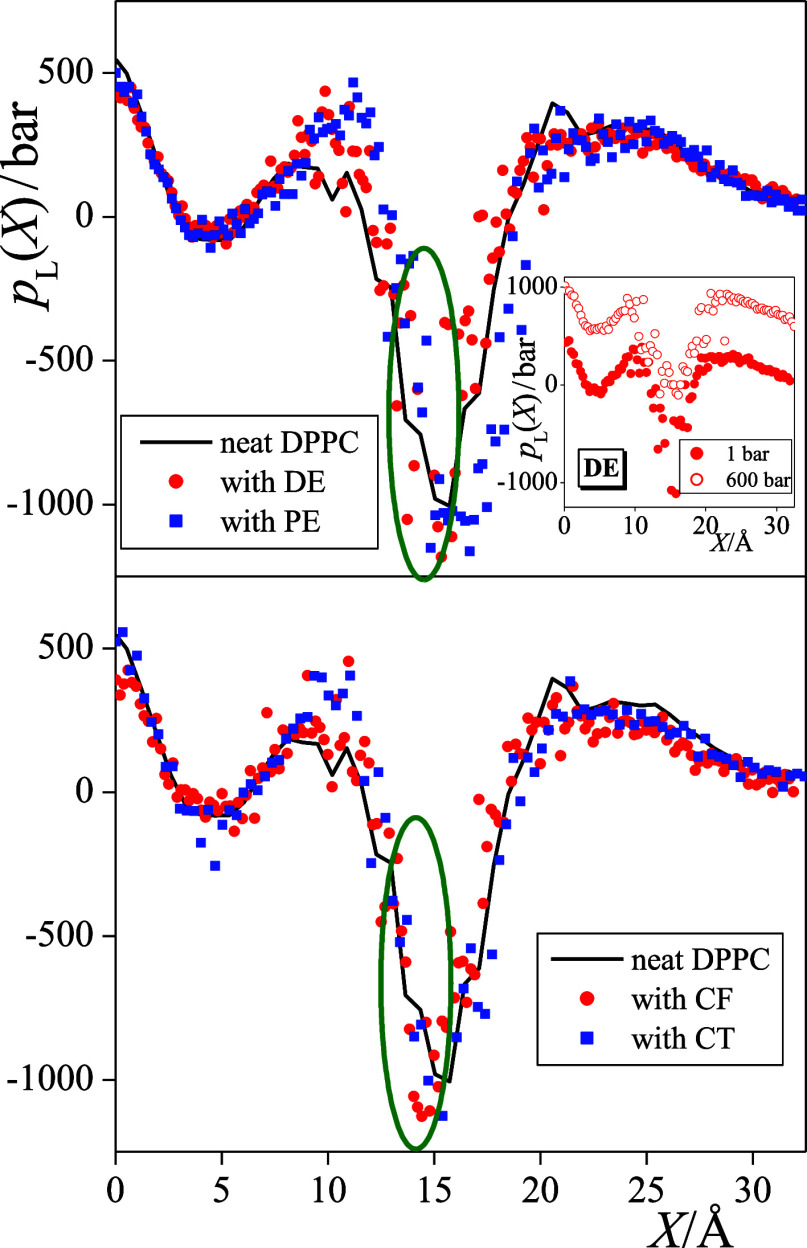
Figure 8.
Profile of the lateral pressure along the membrane normal axis, X, as obtained from the simulations performed at 1 bar. Black solid lines: neat DPPC membrane; red circles: membranes with anesthetics; and blue squares: membranes with non-anesthetics. Top panel: membranes containing the DE/PE anesthetic/non-anesthetic pair and bottom panel: membranes containing the CF/CT anesthetic/non-anesthetic pair. Encircled is the membrane domain in which the lateral pressure is decreased by the anesthetics. To magnify the effect of the solute molecules, the profiles (being already symmetrized over the two leaflets) are only shown in one side of the membrane. The inset shows the lateral pressure profiles obtained in the DE-containing membrane at 1 bar (filled circles) and 600 bar (open circles) from a previous publication (ref (33)).

