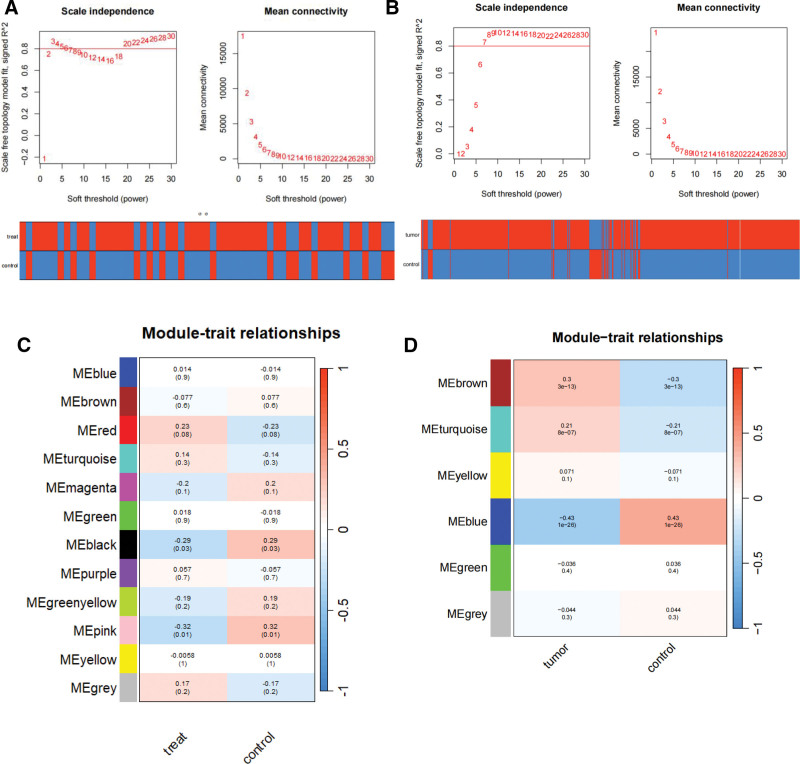
Figure 2.
Coexpression analysis for differentially expressed genes. (A) Pick soft threshold and trait heatmap in GSE150408. (B) Pick soft threshold and trait heatmap of PRAD in TCGA. (C) Heatmap of the module-trait relationships in GSE150408. (D) Heatmap of the module-trait relationships of PRAD in TCGA. TCGA = the Cancer Genome Atlas datasets; Treat = traditional Chinese medicine treatment; Tumor, PRAD = prostate cancer.

