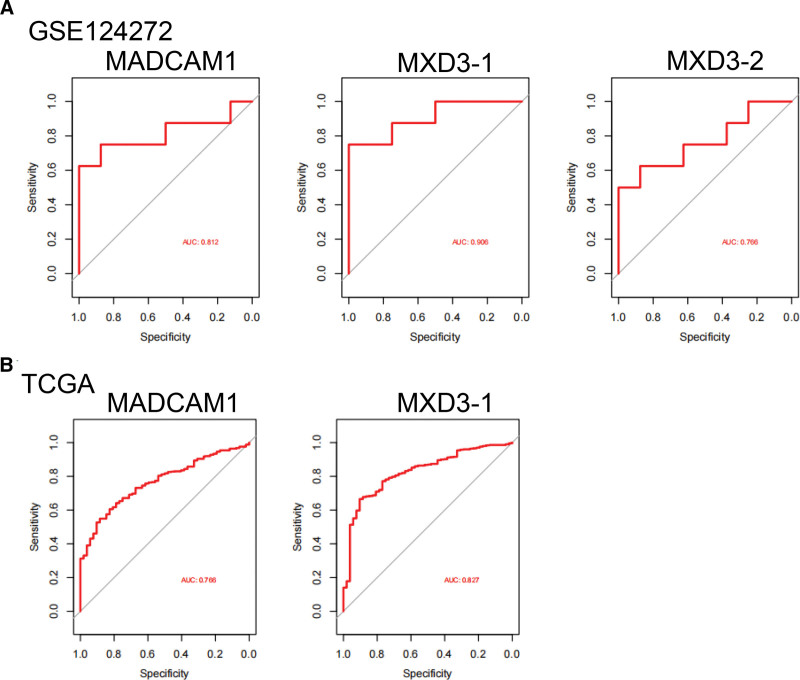
Figure 4.
Expression pattern validation and diagnostic value. (A) ROC curve of MADCAM1, MXD3 in GSE124272. (B) ROC curve of the shared diagnostic genes in TCGA. MXD3 = MAX dimerization protein 3, ROC = the receiver operating characteristics, TCGA = the Cancer Genome Atlas datasets.

