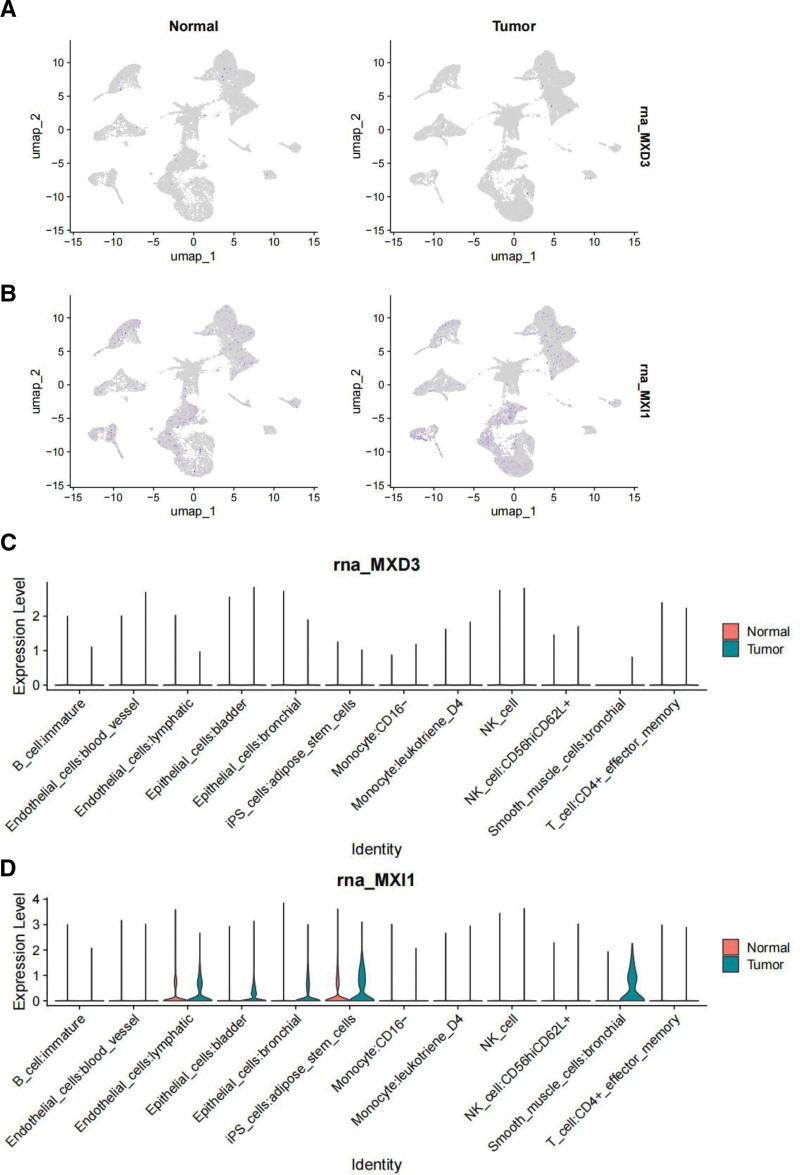
Figure 8.
UMAP plots and violin plots. (A and B) UMAP plots of the expression of MXD3 (A) and MXI1 (B) in different identified cell types in prostate cancer and normal tissue from the GSE193337 datasets. (C and D) The GSE193337 datasets’ violin plots of MXD3 and MXI1 expression in several kinds of annotated cells are displayed in (C) and (D), respectively. MXD3 = MAX dimerization protein 3, MXI1 = MAX interactor 1.

