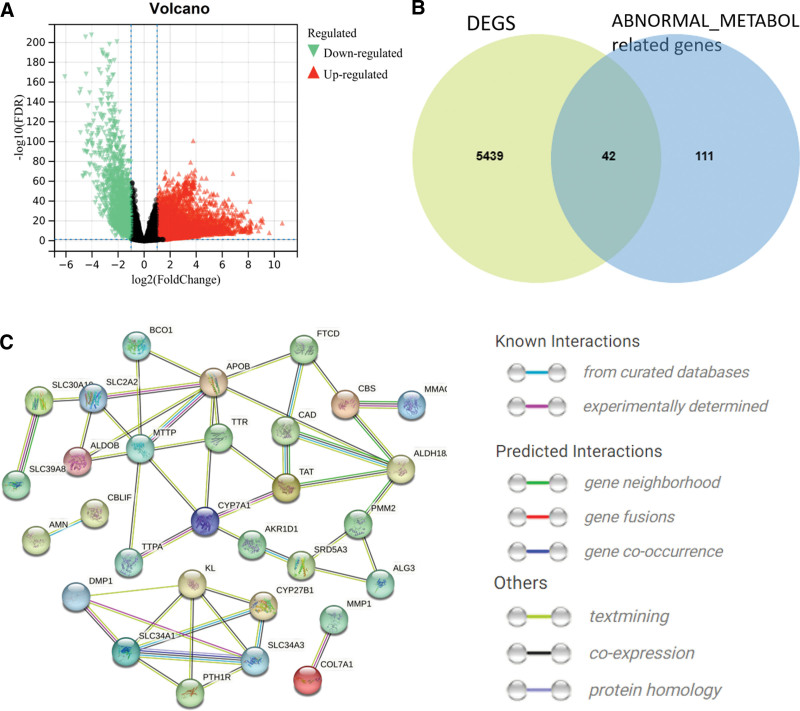
Figure 2.
Screening for abnormal metabolism-related genes. (A) Volcano map of DEGs differentially expressed between LUAD and normal tissues. The selection criteria are |log2FC| >1, FDR value < 0.05 (Red dots indicate log2FC > 1 and FDR value < 0.05. Green dots indicate log2FC < 1 and FDR value < 0.05). (B) Extraction of differentially expressed genes related to abnormal metabolism. Among them, 42 metabolic related genes abnormally express. (C) Differentially expressed metabolic protein interaction network.

