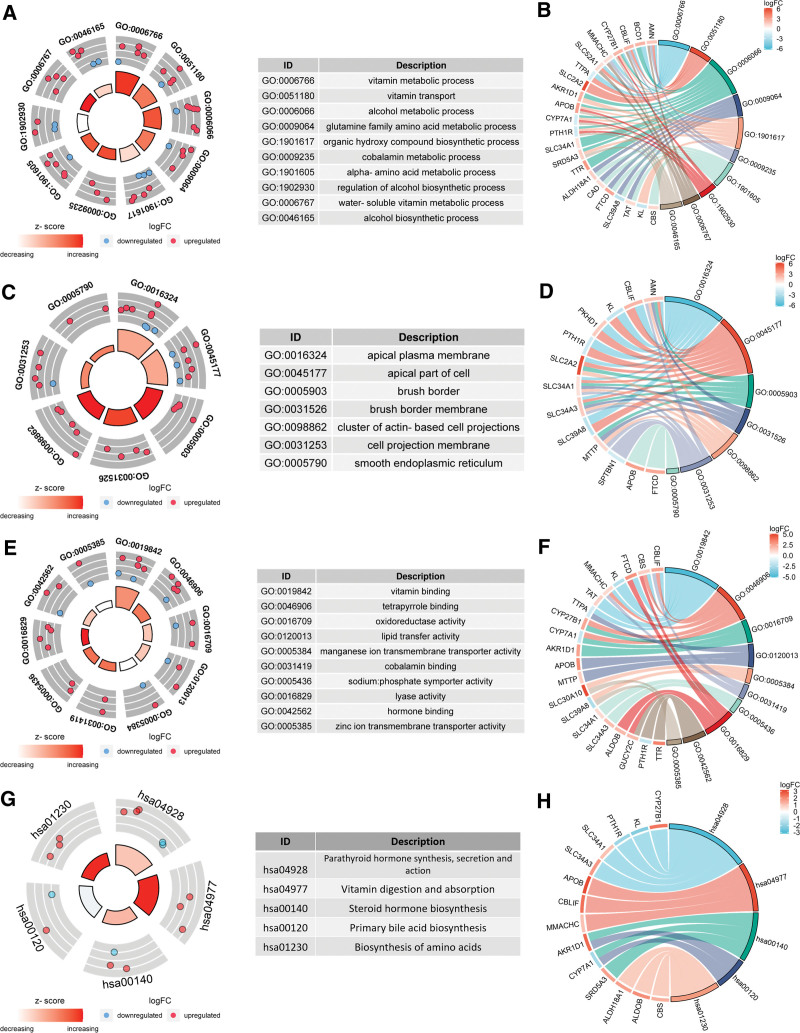
Figure 3.
Functional enrichment analysis of 42 differentially expressed abnormal metabolism related genes. (A) Top 10 BP terms in GO enrichment analysis. The outer circle of the scatterplot shows the logFC identifier of the gene in each term. Red circles indicate up-regulated genes and blue circles indicate downregulated genes. (B) Distribution of genes corresponding to each term in BP. (C) Top 10 CC terms in GO enrichment analysis. (D) Distribution of genes corresponding to each term in CC. (E) Top 10 MF terms in GO enrichment analysis. (F) Distribution of genes corresponding to each term in MF. (G) Top 10 terms in the KEGG pathway. (H) Distribution of genes corresponding to each term in KEGG pathway.

