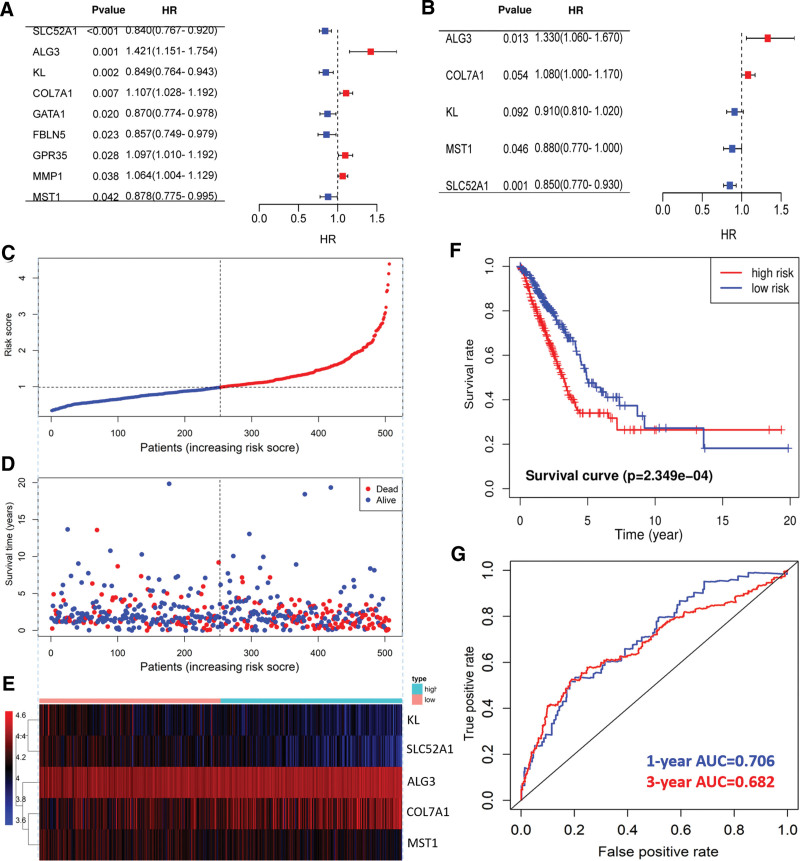
Figure 4.
Establishment and evaluation of prognostic risk model. (A) Univariate Cox analysis of abnormal metabolism-related genes. (B) Multivariate Cox analysis of abnormal metabolism related genes. (C) Scatter plot of LUAD patient risk scores from low to high. Red dots represent high-risk groups. Blue dots represent the low-risk group. (D) Scatter plot distribution of survival time and survival status corresponding to risk scores of high and low-risk groups. (E) Heat map of expression trend of 6 model genes in LUAD patients. The expression was gradually increased from blue to red. (F) Comparison of survival rate between high and low-risk groups. (G) ROC curves to assess the effectiveness of risk models in predicting 1 - and 3-year outcomes.

