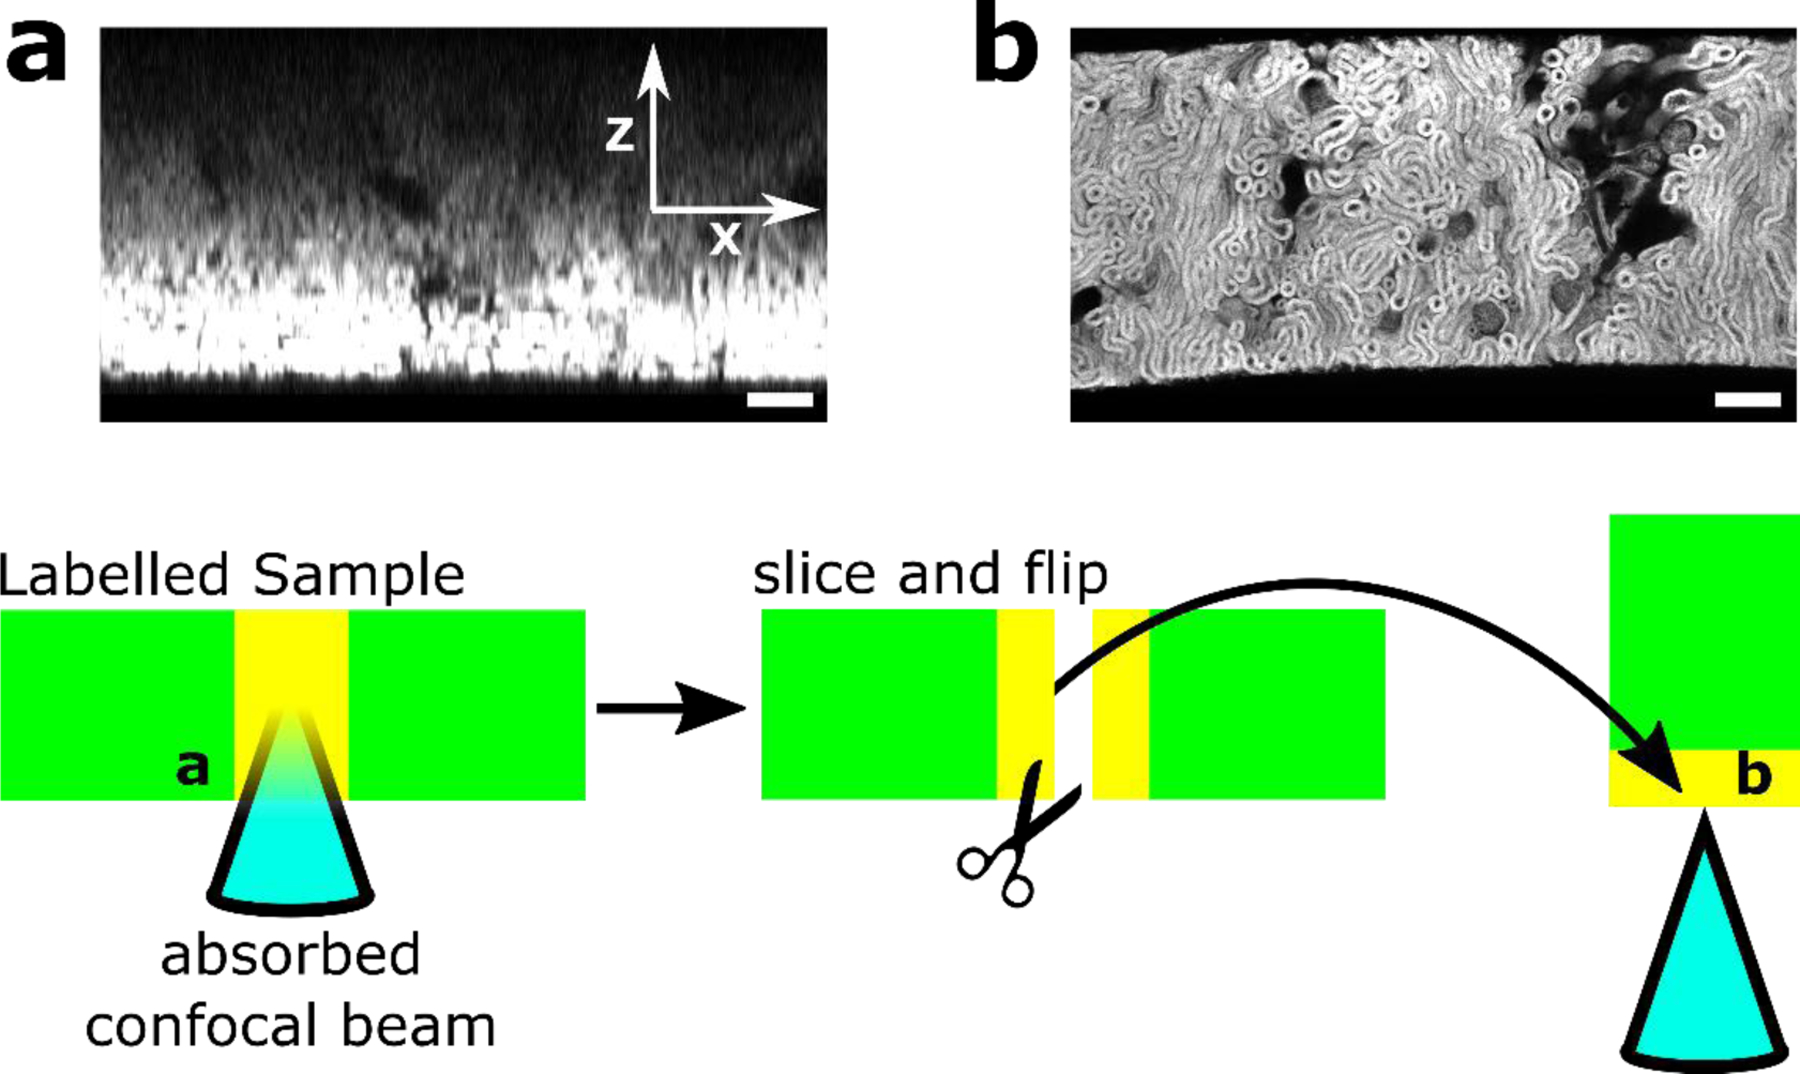
Fig. 12. Demonstration of the inner filter effect for densely-labeled samples.

Confocal images of densely labeled 500 µm sections of human nephrectomy kidney tissue (deidentified and obtained from NW Biotrust) stained with AT647N-NHS ester in MES/THF co-solvent showing prominent inner filter effect, with a figure showing imaging procedure. The inner filter effect results from substantial absorption of the excitation light through the depth of a strongly labeled specimen, giving the impression that labeling is stronger at the surface of a specimen. (a) Cross-sectional view of kidney slice z-stack showing strong signal close to the coverslip with decaying intensity at depth (increasing z distance). The kidney slice was then cut, flipped on edge, and (b) reimaged to show the newly revealed surface. The revealed face showed that the stain was uniform across the sample depth (~500 µm), confirming that the artifact in a indeed resulted from the Inner Filter Effect. See Troubleshooting section. Scale bar: 100 µm (a,b).
