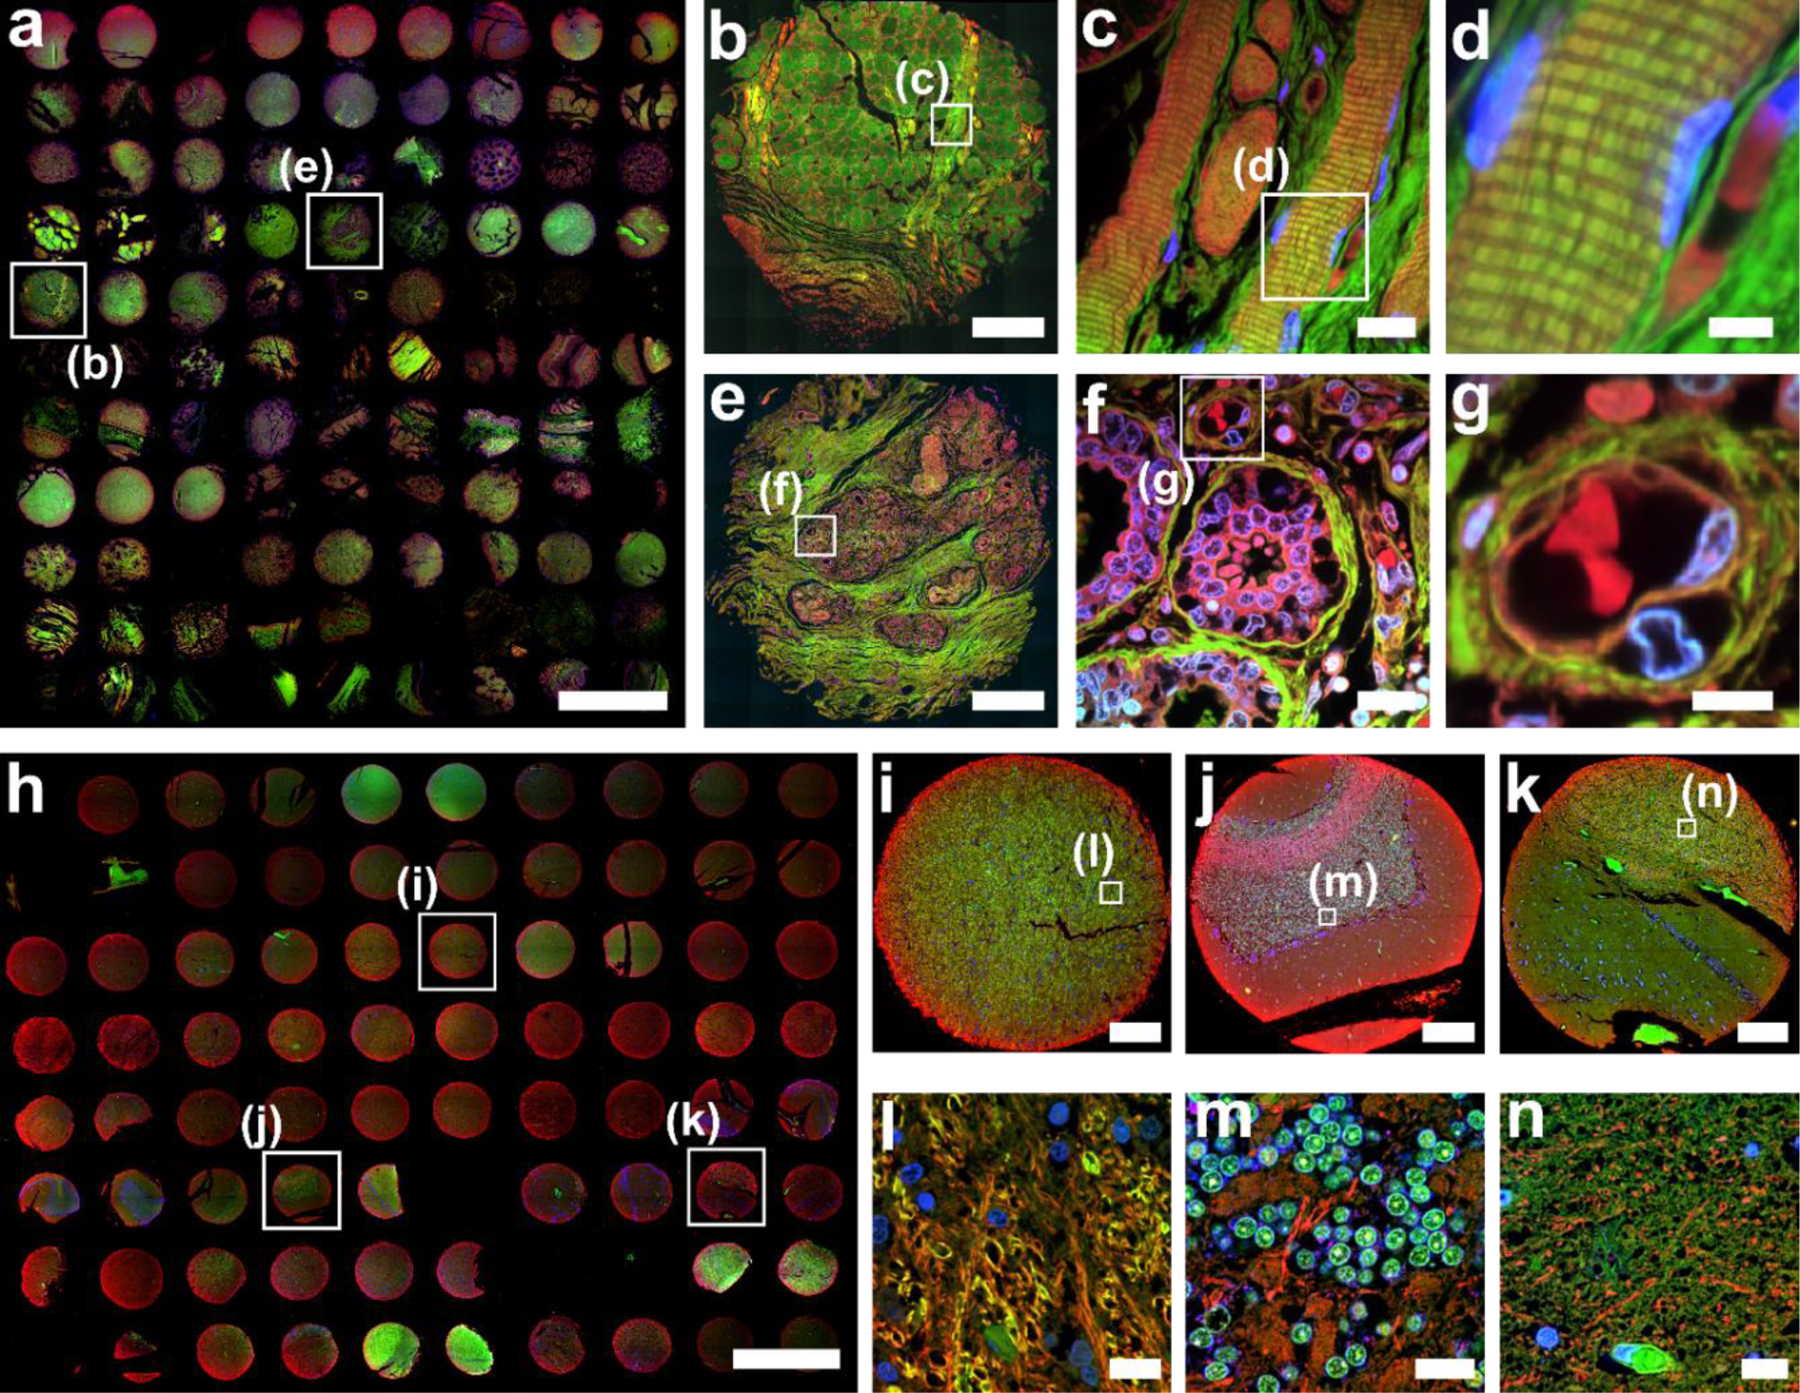
Fig. 4. FLARE staining of 5 µm thick FFPE human tissue microarrays.

(a) Overview image of 96 human organ tissue cores that were FLARE-stained for amines (red), carbohydrates (green), and DNA (blue), and then tiled using a 4× objective lens on a widefield microscope. See also Supplementary Figures 1-2 for a larger version of a) as well as a diagram of which cores represent which tissues. Zoom-in views of a tonsil core from the boxed region in panel a) were recorded by confocal microscopy with (b) tiling using a 20× objective lens and (c-d) single-region imaging using a 60× objective lens. The cross-striations of skeletal muscle fibers were well-visualized in c-d) and fibrocytes and erythrocytes were distinctively labeled in panel d). Zoom-in views of the breast core from the boxed region in panel a) were recorded by confocal microscopy with (e) tiling using a 20× objective lens and (f-g) single-region imaging using a 60× objective lens. Breast lobules surrounded by carbohydrate-rich connective tissue were well-visualized in e-g), as were details of secretory alveoli and nearby blood vessels. (h) Overview image of 75 human brain tissue cores that were FLARE-stained for amines (red), carbohydrates (green), and DNA (blue), and then tiled using a 4× objective lens on a widefield microscope. See also Supplementary Figures 3-4 for a larger version of h) as well as a diagram of which cores represent which regions of the brain. Cores for (i) midbrain, (j) cerebellum, and (k) hippocampus, selected from panel h), highlight the variable distribution of amines and carbohydrates within the brain. Zoom-in views (l-n) of the regions indicated in boxes of (i-k) were imaged using a 60× objective lens, revealing highly distinct tissue morphologies such as the cell bodies of cerebellar granule cells that are brightly labeled by the carbohydrate stain in (m). Scale bars are 3 mm (a, h), 300 μm (b,e,i-k), 15 μm (c, f, l-n), 6 μm (d, g). The custom Wolfram Mathematica scripts used for stitching tiling images (Fig. 4a and 4h) are available as Supplementary Code.
