
Fig. 8. FLARE labeling of ~1 mm thick kidney tissue.
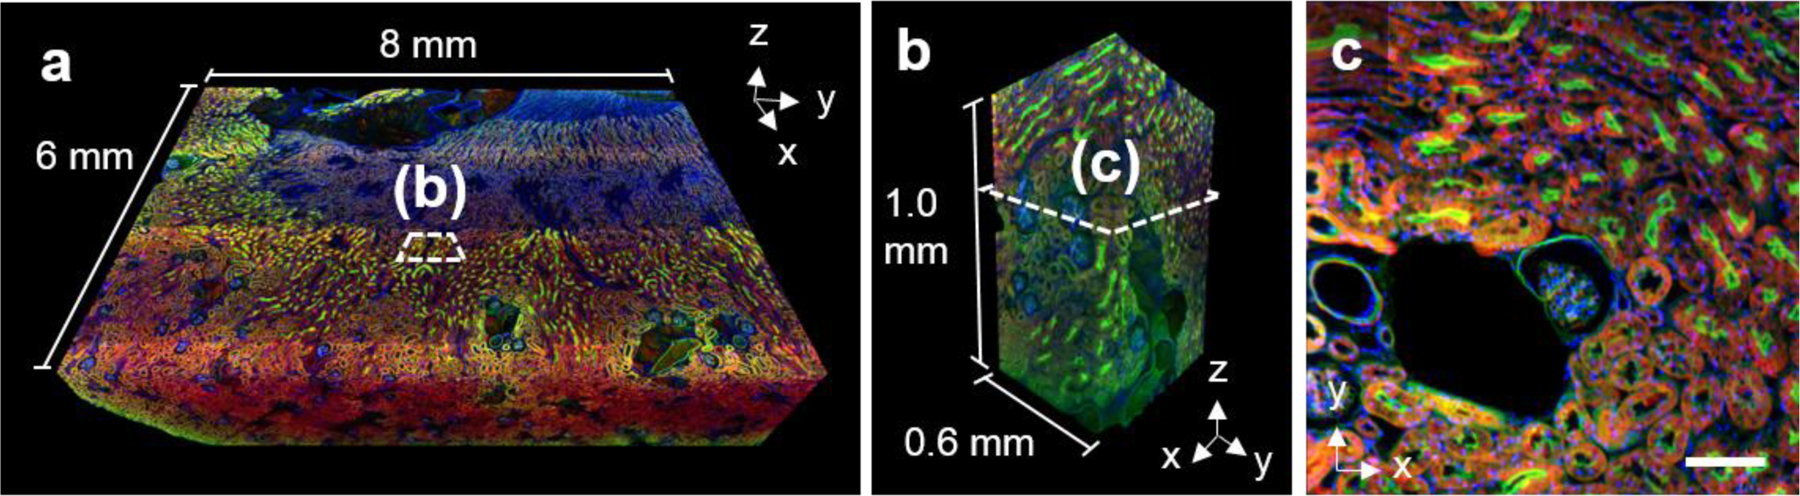
(a) Volumetric imaging of a large mouse kidney section (8 mm × 6 mm × 1 mm) imaged with open-top light-sheet microscopy. Amines (red), carbohydrates (green), and DNA (blue) reveal unique structures throughout the tissue. (b) The zoom-in view from the boxed region in panel a) shows that there is uniform labeling of structures through the full ~1 mm tissue thickness. (c) A single optical section from the boxed region in panel b) demonstrates highly specific amine, carbohydrate, and DNA staining of kidney tissue microstructure. Scale bar, 100 μm (c).