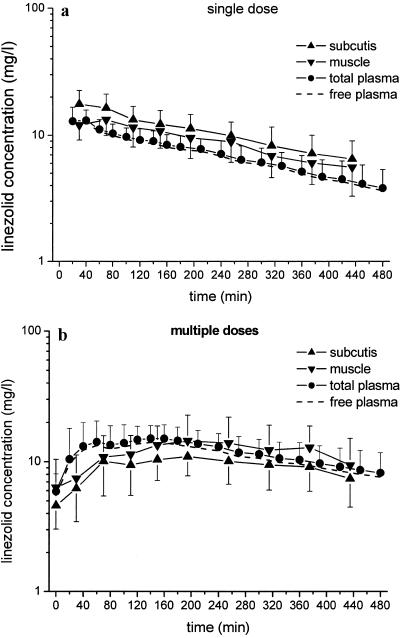
FIG. 1.
Time-concentration curves (means ± SDs) of linezolid in plasma (total and free) and ISF of subcutaneous adipose tissue and skeletal muscle. (a) Profile after administration of a single intravenous dose of 600 mg (n = 10); (b) concentration-versus-time profile after multiple doses of oral linezolid intake (600 mg twice a day; n = 9).

