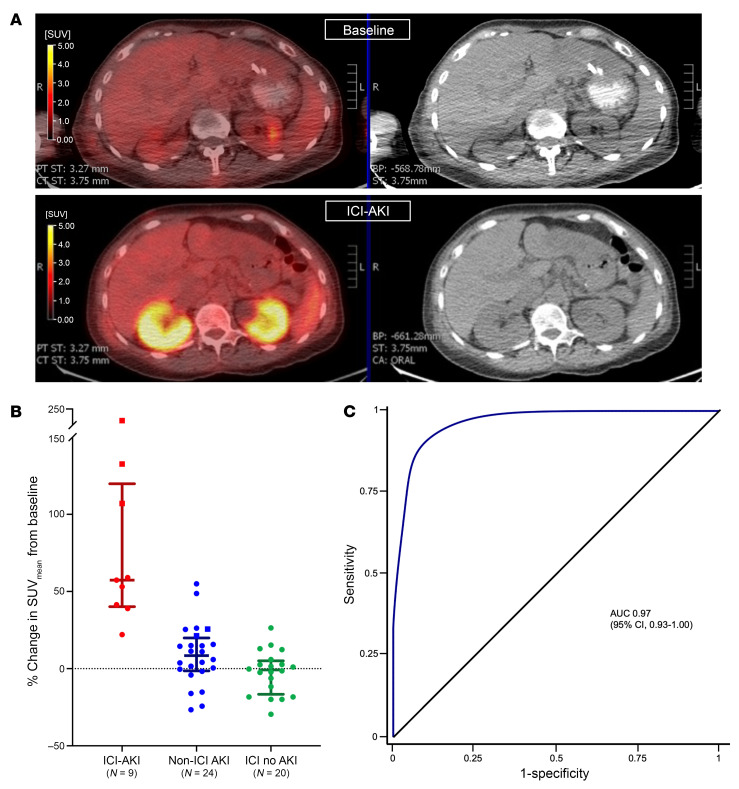
Figure 1. F18-FDG PET-CT and ICI-AKI.
(A) Representative F18-FDG PET-CT images at baseline (top panels) and at the time of ICI-AKI (lower panels). (B) Percentage change in SUVmean from baseline to the time of AKI among patients with ICI-AKI (red), AKI from other causes (blue), and patients receiving ICI therapy without AKI (green). Biopsy-proven patients are represented by squares, and clinically adjudicated patients with circles. (C) ROC curve of percentage change in SUVmean for differentiation of ICI-AKI from AKI from other causes.

