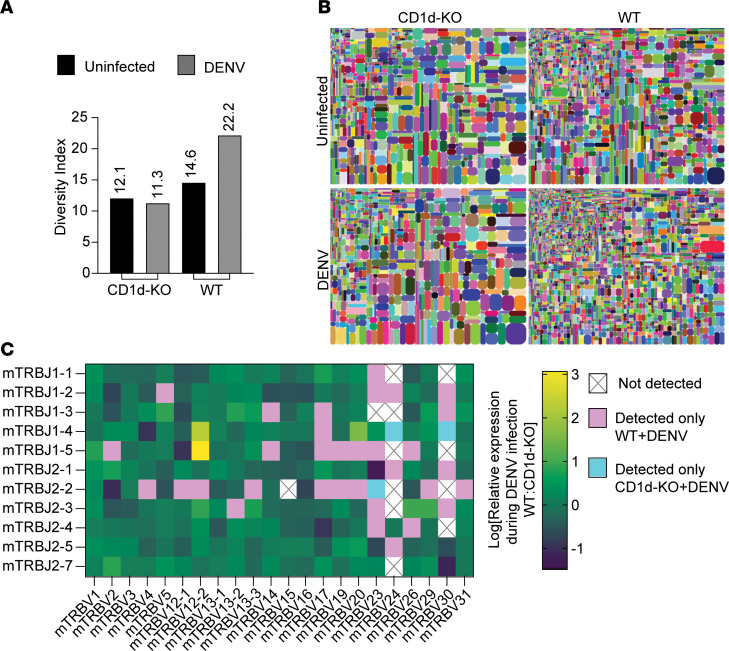
Figure 3. Reduced diversity of NKT cell TCR clones in LNs of DENV-infected CD1d-KO mice.
CD3+NK1.1+ T cells from mouse dLNs (mesenteric and iliac) collected and pooled from n = 3 mice per group were harvested and sorted 72 hours after i.p. infection with DENV. The TCR-β region was sequenced to identify the abundance of unique clones. (A) Diversity index calculated by iRepertoire software iRweb, version 3.0.1, which reflects the diversity of unique CDR3s clones sequenced for each sample. (B) Tree map illustration of diversity for the respective samples. (C) Heatmap of the relative frequencies of given V gene and J gene combinations. The clones uniquely identified in WT and CD1d-KO mice are overlaid in pink and blue, respectively.

