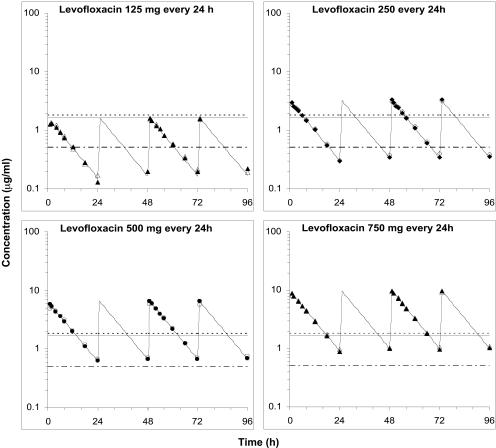
FIG. 2.
Measured central (filled symbols) and peripheral (open symbols) compartment concentrations for simulated levofloxacin dosage regimens. The fitted curves from the one-compartment pharmacokinetic model are superimposed on the symbols. The levofloxacin MICs for MRSA 8043 and MRSA 8282 are depicted by the lower dot-and-dash horizontal line. The levofloxacin MPCs for MRSA 8043 (solid line) and MRSA 8282 (dashed line) are also shown.

