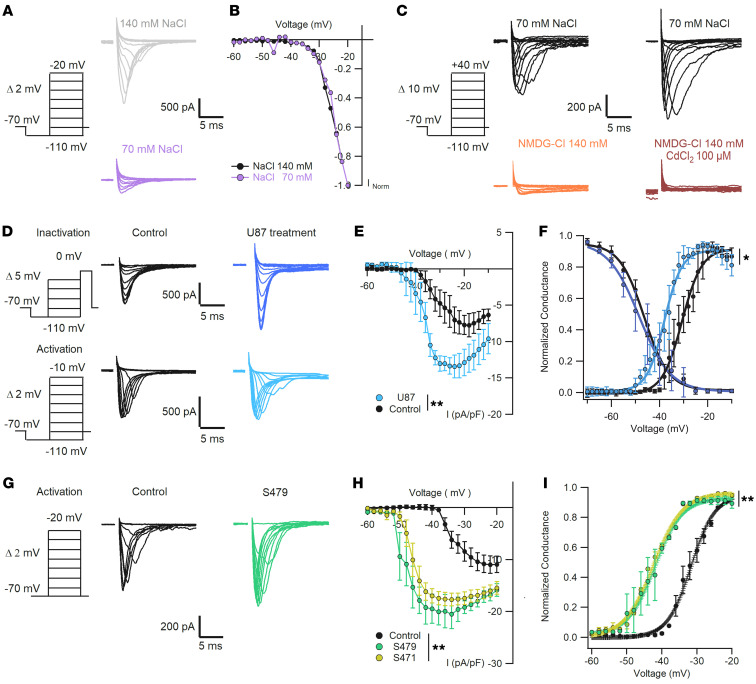
Figure 5. Increased spontaneous firing is associated with a shift of the activation curve of the inward voltage-dependent Na+ current.
(A) Representative traces of voltage-dependent Na+ current activation in the presence of 140 mM (gray) and 70 mM (purple) NaCl. (B) Normalized currents in A show similar voltage activation dependence. Kruskal-Wallis test, P > 0.05, n = 5. (C) Replacement of NaCl by NMDG-Cl shows a residual small inward current (orange) blocked by addition of CdCl2 100 μM (brown); n = 5. (D) Representative traces of voltage-dependent Na+ currents obtained with CdCl 100 μM in the extracellular solution and internal solution with CsCl 135 mM plus NaCl 5 mM. Currents were recorded with the protocols used for activation and inactivation in control (black: n = 7–10) and U87 exosome–treated (blue: n = 12–14) neurons. (E) I-V curve comparing current density as in D, showing increased current in treated neurons (Kruskal-Wallis test, **P < 0.01). (F) Dependence of normalized conductance G/max G as a function of voltage for control and treated neurons, showing an average V1/2 shift of –6.4 mV (values in main text; *P < 0.05, Mann-Whitney U test). (G) Representative traces of Na+ currents activated under control conditions (black, n = 7) and in neurons treated for 24 hours with exosomes from patient S479 (green, n = 7). (H) Average I-V curves of Na+ currents for control and patient exosome–treated neurons, showing higher Na+ current density in cells treated with patients’ exosomes (**P < 0.01, Kruskal-Wallis test). (I) Normalized conductance curve for the conditions in H showing early activation of the Na+ conductance of neurons treated with patients’ exosomes (V1/2 shift of –12 ± 7.2 mV, values in main text; **P < 0.01, Mann-Whitney U test). Voltage clamp protocols to test Na+ current activation and inactivation are shown on the left of each panel.

