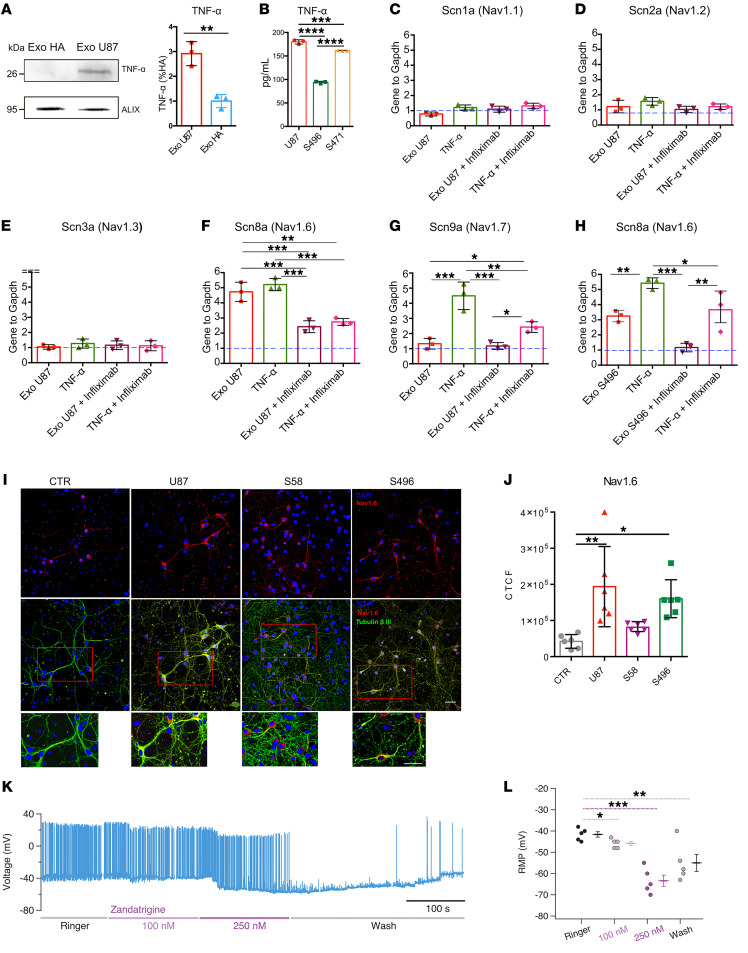
Figure 6. Exosomal TNF-α induces Nav1.6 overexpression.
(A) Lysates of HA and U87 exosomes were analyzed by SDS-PAGE followed by Western blotting (left) using anti–TNF-α and ALIX antibodies. Quantification of TNF-α (right) was obtained by normalization to the exosome marker ALIX and is reported as percentage with respect to HA (n = 3; **P < 0.01, 2-tailed t test). (B) Quantification of TNF-α in U87 and patients S496 and S471’s exosomes using ELISA (n = 3 cultures). (C–G) Real-time PCR quantification of Scn1a, Scn2a, Scn3a, Scn8a, and Scn9a in hippocampal neurons treated with U87 exosomes (Exo U87), TNF-α, U87 exosomes plus infliximab pretreatment, and TNF-α plus infliximab pretreatment. (H) Real-time PCR quantification of Scn8a using patient S496’s exosomes. Blue dashed line represents gene expression under control conditions, set to 1. Each gene is normalized to the housekeeping Gapdh gene. n = 3 cultures. (I) Hippocampal neurons were exposed to control (CTR), U87, patient S58, and patient S496 exosomes; fixed; and stained with anti-Nav1.6 (red channel), anti–βIII-tubulin (green channel), and DAPI to stain nuclei (blue channel). Scale bars: 50 μm. (J) Quantification of the experiment in I reported as corrected total cell fluorescence (CTCF). n = 6 coverslips from 2 dissections. Each point represents the average of 4 fields acquired for each coverslip. All data are shown as mean with SD. *P < 0.05, **P < 0.01, ***P < 0.001, ****P < 0.0001, 1-way ANOVA followed by Dunnett’s post hoc test. (K) Representative current clamp recordings from a treated neuron in the presence of increasing amounts of zandatrigine. Zandatrigine 250 nM blocked the spontaneous AP firing; this effect was partially reversible following blocker removal. (L) Quantification of the zandatrigine effect on RMP. *P < 0.05, **P < 0.01, ***P < 0.001, Kruskal-Wallis followed by Bonferroni-corrected Dunn’s test, n = 5.

