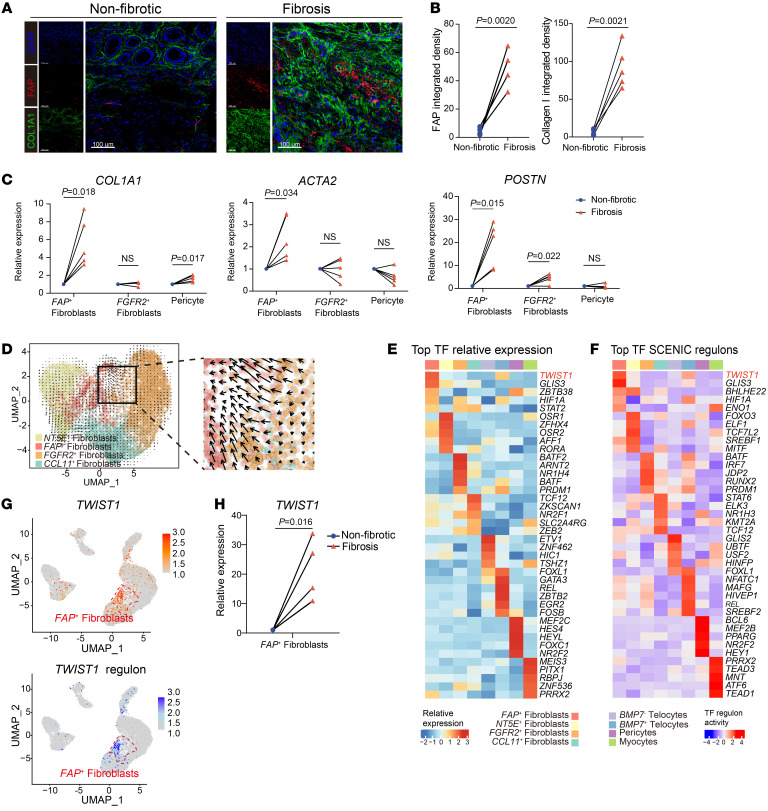
Figure 3. TWIST1 is a critical transcription factor in the differentiation of FAP+ fibroblasts.
(A) Representative IF staining of human fibrotic and nonfibrotic intestinal tissue (original magnification, ×20). DAPI (blue), FAP (red), and COL1A1 (green) in individual and merged channels are shown. Scale bar: 100 μm. (B) Quantitative analysis (integrated fluorescence intensity) of FAP and COL1A1 in IF staining. The points corresponding to the paired samples (n = 5) in the graph are connected. Statistical differences were determined by paired t tests. (C) The mRNA levels of COL1A1, ACAT2, and POSTN in FAP+ fibroblasts, FGFR2+ fibroblasts, and pericytes sorted from fibrotic and nonfibrotic sites were analyzed by qPCR. The points corresponding to the paired samples (n = 5) in the graph are connected. Statistical differences were determined by paired t tests. (D) RNA velocity of 4 fibroblast subclusters. Color is as in Figure 2A. The inferred developmental trajectory of FAP+ fibroblasts enlarged. (E) Heatmap showing the relative expression (Z score) of the top 5 transcription factor (TF) genes in each MSC subtype. Color is as in Figure 2A. (F) Heatmap showing the normalized activity of the top 5 TF regulons in MSC subtypes predicted by SCENIC. Color is as in Figure 2A. (G) Feature plots showing the expression of TWIST1 (top) and the activity of TWIST1 regulon (bottom). The position of FAP+ fibroblasts is red circled. (H) The mRNA levels of TWIST1 in FAP+ fibroblasts sorted from fibrotic and nonfibrotic sites were analyzed by qPCR. The points corresponding to the paired samples (n = 5) in the graph are connected. Statistical differences were determined by paired t tests.

