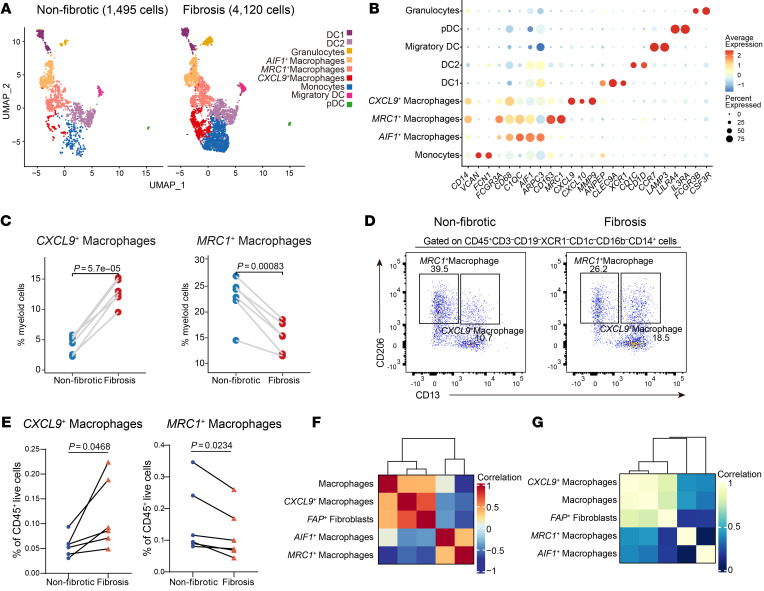
Figure 4. Identification of profibrotic macrophage phenotypes in intestinal fibrosis.
(A) UMAP plots of the subclustered myeloid cells in the nonfibrotic and fibrotic states. (B) Dot plots of the representative markers of subclustered myeloid cells. The average gene expression levels and percentage of cells expressed are shown by dot color and size, respectively. (C) Comparison of frequencies of CXCL9+ macrophages and MRC1+ macrophages of myeloid cells in paired fibrotic intestinal samples (n = 6) and nonfibrotic intestinal samples (n = 6). Statistical differences were determined by paired t tests. (D) Representative flow cytometry plots of CXCL9+ macrophages and MRC1+ macrophages in fibrotic and nonfibrotic mucosa samples. The gating strategies for MSCs are shown in Supplemental Figure 5F. (E) Flow cytometry analysis revealed the proportion variation in CXCL9+ macrophages and MRC1+ macrophages to CD45+ live cells in fibrotic and nonfibrotic sites. The points corresponding to the paired samples (n = 6) in the graph are connected. Statistical differences were determined by paired t tests. (F) Heatmap showing the correlation between the percentages of total macrophages and macrophage subsets and FAP+ fibroblasts across 12 scRNA-Seq samples. (G) Heatmap showing the gene signature correlation between total macrophages and macrophage subsets and FAP+ fibroblasts in an RNA-Seq dataset (GSE192786, n = 40).

