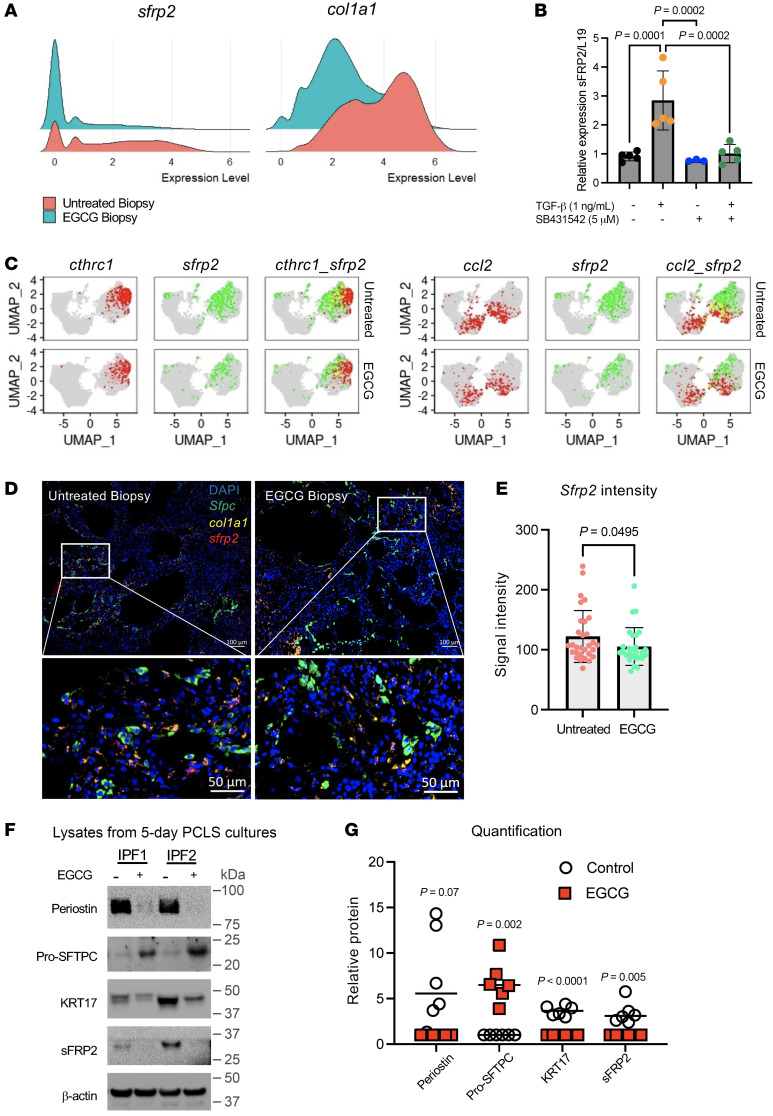
Figure 4. Impact of EGCG on distribution of sFRP2 expression in fibroblast subpopulations, biopsy tissues, and PCLS cultures.
(A) Ridge plot of sfrp2 and col1a1 gene expression in alveolar and pathologic fibroblast subtypes from untreated and EGCG biopsy samples. (B) Relative expression of sfrp2 mRNA in human fibroblasts treated with TGF-β1 (1 ng/ml) and/or TGF-β inhibitor SB4331542 (5 μM) for 48 hours (n = 5). (C) Feature plots of sfrp2 gene expression (green) in various fibroblast subsets characterized by cthrc1 or ccl2 gene expression (red). Cells expressing both sfrp2 and cthrc1 or ccl2 are indicated in yellow. Additional fibroblast markers are shown in Supplemental Figure 4B. (D and E) RNA in situ hybridization was performed for col1a1 (yellow) and sfrp2 (red) genes in untreated and EGCG biopsies (D). The signal intensity of sfrp2 was quantified for each image (E). Representative images of n = 5 samples per group, 4–6 images per sample. Original magnification, ×100 (top images). Bottom images represent a region of interest as indicated by white rectangle. (F and G) PCLSs from IPF lung donors cultured for 7 days with EGCG (1 μM) and analyzed by Western blot. Additional samples are shown in Supplemental Figure 5C. (G) Graphical representation of the level of expression of selected proteins for all samples (see Supplemental Figure 5C). n = 6. Statistical significance was determined by the Kruskal-Wallis test (B) and 2-tailed t test (E and G).

