
Fig. 4. Kidney gene expression of markers of PT maladaptation and PT cells in healthy states in 17 participants with AKI and in mouse models of AKI.
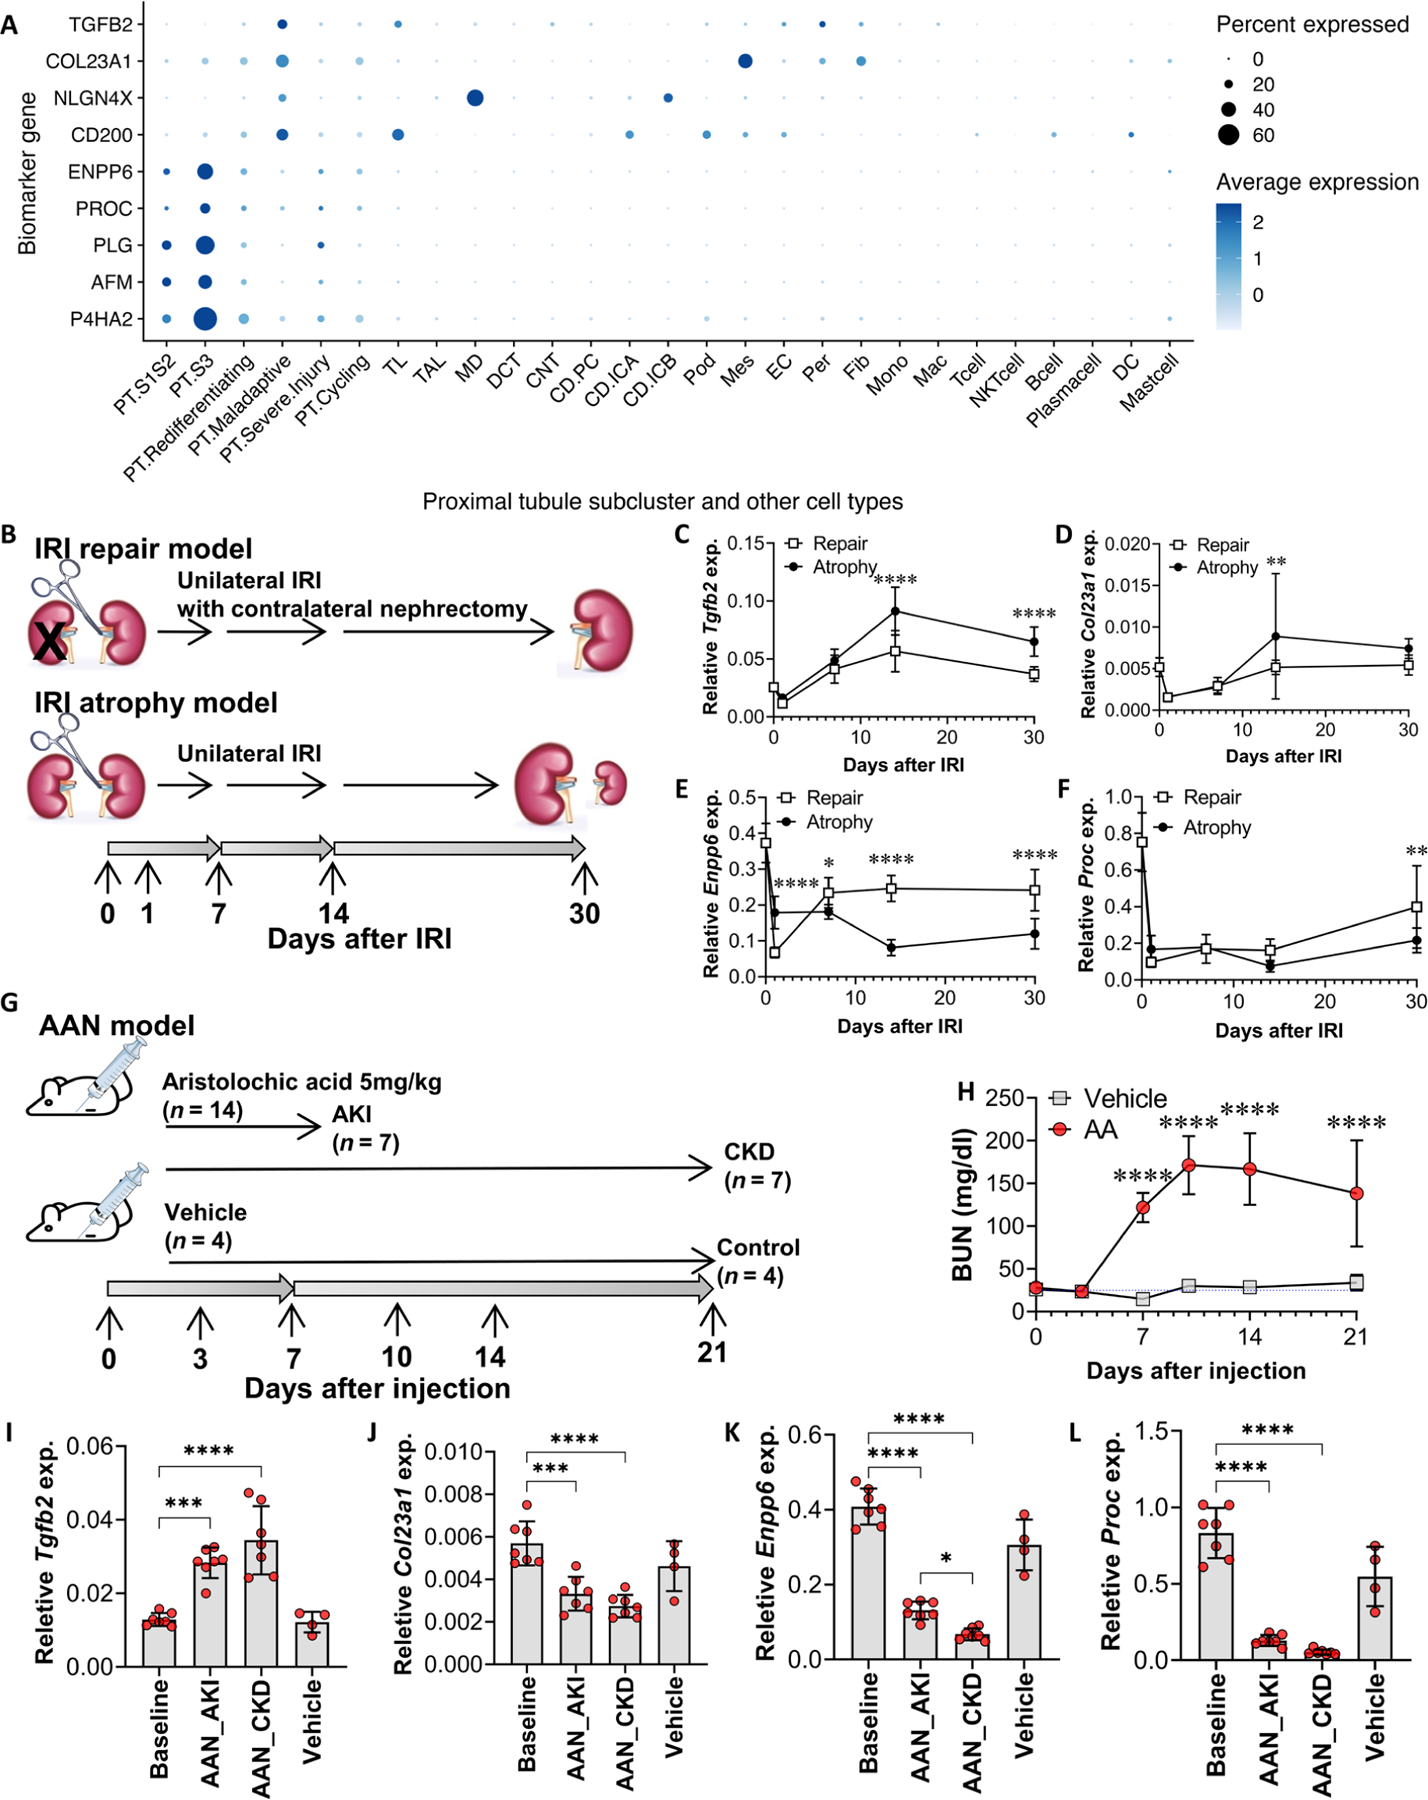
(A) Tissue gene expression of identified markers in 17 participants with AKI from the KPMP cohort at single-nucleus resolution. (B) Wild-type mice were subjected to unilateral IRI (atrophy model) or IRI with contralateral nephrectomy (repair model) (31). Quantitative RT-PCR analysis was performed on whole-kidney RNA harvested 0 (healthy control), 1, 7, 14, and 30 days after injury; n = 9 or 10 kidneys per time point per model. (C to F) Gene expression of Tgfb2 (C), Col23a1 (D), Enpp6 (E), and Proc (F) was compared across time course and between the atrophy versus repair model, using two-way ANOVA followed by Šidák’s posttests (*P < 0.05; **P < 0.01; ****P < 0.0001 at the indicated time points). (G and H) Wild-type mice were subjected to intraperitoneal injection of aristolochic acid (5 mg/kg ) (n = 14) or vehicle (n = 4). Blood samples were collected on days 0, 3, 7, 10, 14, and 21 for blood urea nitrogen (BUN) measurements. Quantitative RT-PCR analysis was performed on whole-kidney RNA harvested on days 0 (baseline), 7 (AKI phase, n = 7), and 21 (CKD phase, n = 7) after aristolochic acid injection, and day 21 (controls, n = 4) after vehicle injection. (I to L) Gene expression of Tgfb2 (I), Col23a1 (J), Enpp6 (K), and Proc (L) was compared using ANOVA followed by the Tukey’s test for subgroup comparison (*P < 0.05, ***P < 0.001, and ****P < 0.0001 comparing gene expression at AKI and CKD time points to baseline by Student’s t tests).