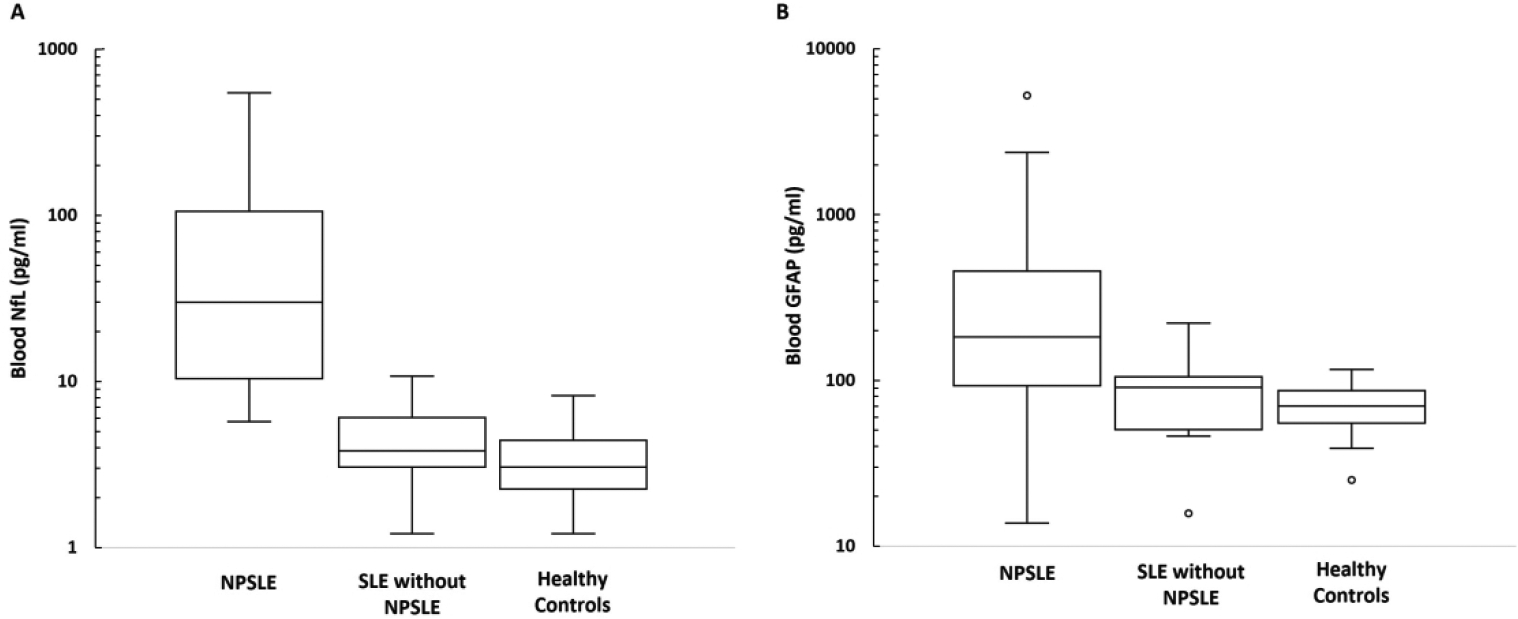
Figure 1.

Box and whisker plots showing the distribution of blood neurofilament light (NfL) (A) and glial fibrillary acidic protein (GFAP) (B) between patients with active major neuropsychiatric lupus (NPSLE), systemic lupus erythematosus (SLE) without active major NPSLE, and healthy controls. Y-axis is shown on a logarithmic scale.
