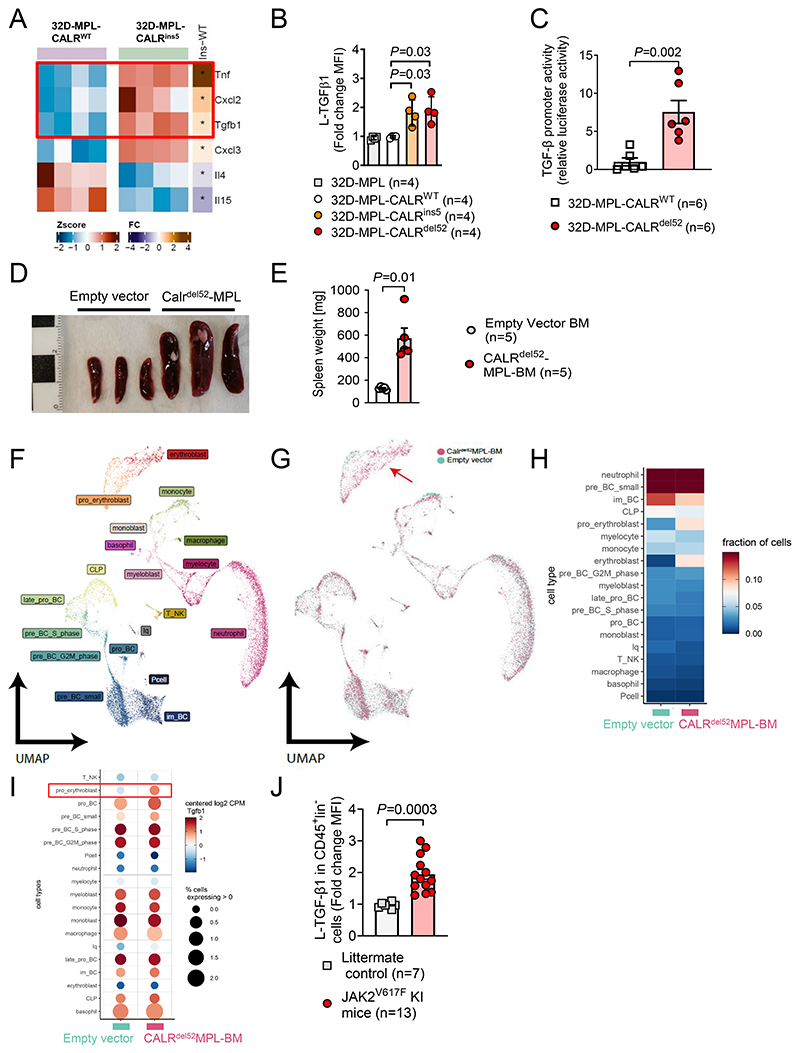
Figure 1. Mutant CALR induces TGF-β production.
(A) Heat map showing expression profile of MPL-CALRins5 transduced 32D cells versus MPL-CALRWT. Relative expression of selective immune regulatory cytokines is plotted. Colour codes represents the Z-score log2 intensity. RNA was harvested from four independent IL3-starved cell cultures. Differential gene expression analysis was performed with the linear model-based approach (limma R package).
(B) Scatter plot showing fold change of MFI from L-TGF-β1 expressed on MPL-CALR-/WT/del52 transduced 32D cells after IL-3 withdrawal. Four independent experiments were performed and the results were pooled. P-values were calculated using one-way ANOVA.
(C) Scatter plot showing TGF-β promoter activity (luciferase activity relative to mean of WT control) of 32D-MPL-CalrWT or 32D-MPL-Calrdel52 cells. Cells transfected with the pGL3-TGFβ1 promotor vector. Pooled data from six independent experiments. P values were calculated using Mann-Whitney test.
(D, E) Spleens of mice isolated 21 days after injection of either Empty vector (EV) or CALRdel52-MPL transduced Bone Marrow (BM). Exemplary picture (scale in cm) (D) and scatter plot (E) showing quantification of weight of spleens of mice 21 days after injection of either EV- or CALRdel52-MPL transduced BM.
(F-I) Single-cell RNA Sequencing (sc-RNA-Seq) of bone marrow from mice 21 days after injection of either EV- (n=2) or CALRdel52-MPL (n=2) transduced BM. UMAP depicting clustering into different cell populations (F), UMAP of EV- and CALRdel52-MPL condition merged (G), heat-map depicting fraction of cells in each cluster (H) and bubble plot depicting TGF-β1 expression in different clusters combining fraction cells expressing TGF-β1 (% - relative expression to mean >0) and expression within clusters relative to mean expression level over all clusters (I). The red arrow indicates the erythroblast population in bone marrow of mice that received CALRdel52-MPL BMC.
(J) Scatter plot showing TGF-β protein expression (fold change of MFI) of CD45+ lineage marker negative cells isolated from JAK2V617F knock-in mice or littermate controls as indicated. Each data point is a biological replicate (individual mouse). P values were calculated using an unpaired Student’s t-test (E, J).

