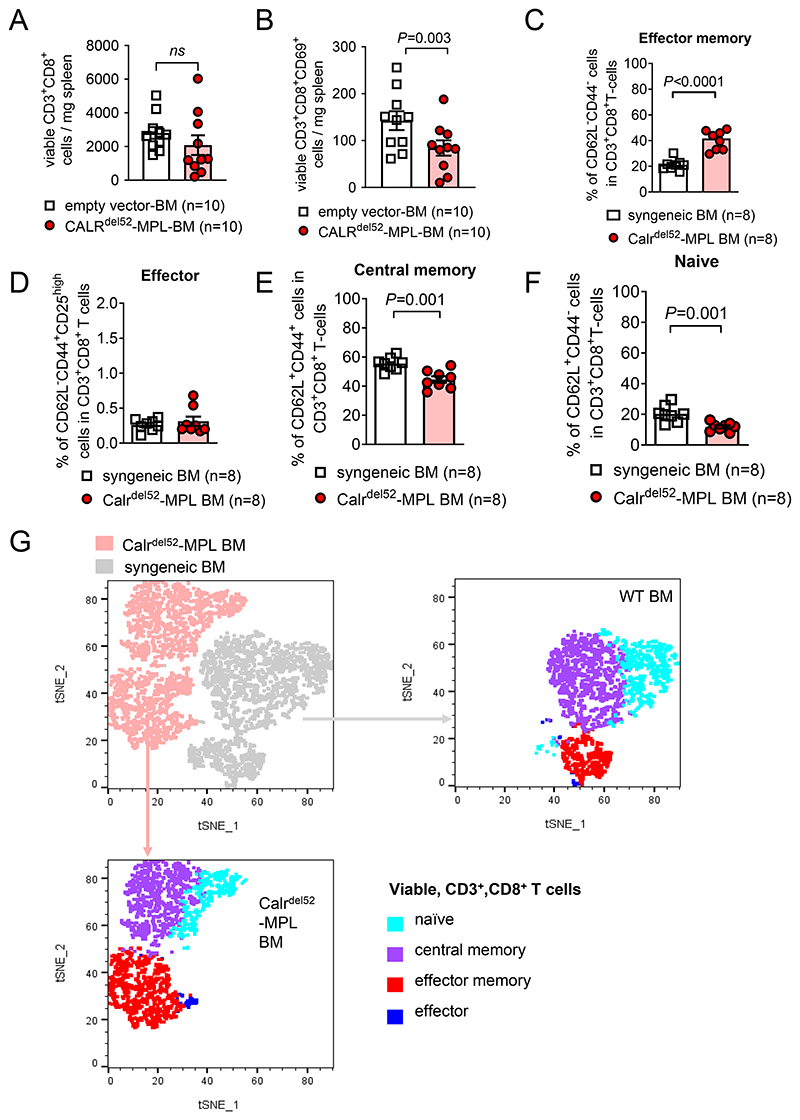
Figure 2. T cell phenotype in mice with CALRdel52-MPL or control BM.
(A, B) Scatter plot showing absolute counts of total CD3+CD8+ T cells (A) and CD3+CD8+CD69+ activated T cells (B) isolated from the spleens of mice injected with BM cells expressing CALRdel52-MPL or control BM. Pooled data from two individual experiments. P values were calculated using unpaired Student’s t-test.
(C-F) Scatter plot showing frequencies of effector memory (CD62L- CD44-) T cells (C), effector (CD62L- CD44+) T cells (D), central memory (CD62L+ CD44+) T cells (E) and naïve (CD62L+ CD44-) T cells (F) in total CD3+CD8+ viable T cells isolated from the spleens of mice injected with BM cells expressing CALRdel52-MPL or control BM. Pooled data from two individual experiments. P values were calculated using unpaired Student’s t-test.
(G) Representative dot plot showing t-distributed stochastic neighbour embedding (t-SNE) of viable CD3+CD8+ T cells derived from the spleens of mice injected with BM cells expressing CALRdel52-MPL or control BM. For visualization, previously gated T cell subsets (C-F) are superimposed as indicated.

