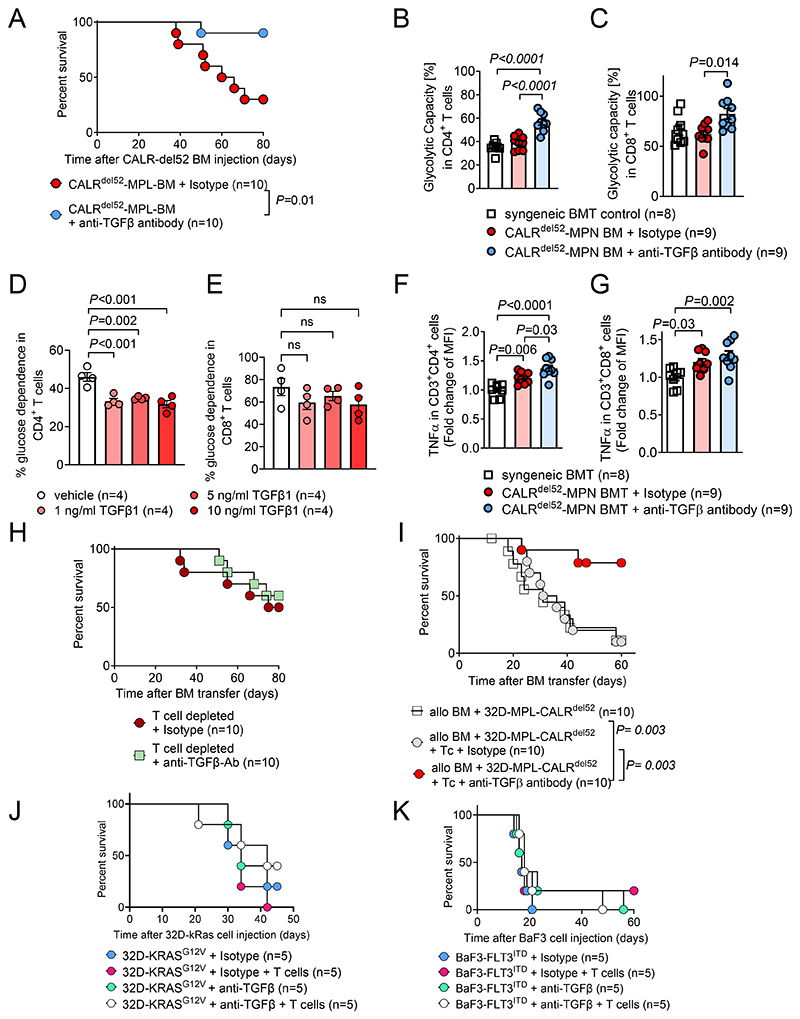
Figure 3. In vivo TGF-β neutralization improves survival of CALRdel52 driven MPN.
(A) Kaplan-Meyer curve showing percent survival of mice injected with BM cells expressing CALRdel52-MPL. Mice were treated with anti-TGFβ1,2,3 neutralizing antibody or respective isotype controls on day 12, 16 and 20 post bone marrow transplantation. Pooled data from two individual experiments.
(B, C) Scatter plot showing glycolytic capacity of CD4+ (B) and CD8+ (C) T cells isolated from spleen of mice injected with syngeneic BM or syngeneic BM cells expressing CALRdel52-MPL. Mice were treated with anti-TGFβ1,2,3 neutralizing antibody or respective isotype controls on day 12, 16 and 20 post bone marrow transplantation. Pooled data from two individual experiments.
(D, E) Scatter plot showing glucose dependence (%) in CD4+ (D) and CD8+ (E) T cells activated using CD3/CD28 activator beads and treated with indicated concentrations of TGF-β for 24h. Pooled data from four individual experiments.
(F, G) Scatter plot showing fold change of TNF-α MFI in CD3+CD4+ (F) and CD3+CD8+ (G) T cells isolated from spleen of mice injected with syngeneic BM or syngeneic BM cells expressing CALRdel52-MPL. Mice were treated with anti-TGFβ1,2,3 neutralizing antibody or respective isotype control on day 12, 16 and 20 post bone marrow transplantation. Pooled data from two individual experiments.
(H) Kaplan-Meyer curve showing percent survival of mice injected with BM cells expressing CALRdel52-MPL. Mice received weekly T cell depleting therapy (anti-CD4 and anti-CD8 antibody) and were treated with anti-TGFβ1,2,3 neutralizing antibody or respective isotype control on day 12, 16 and 20 post bone marrow transplantation. Pooled data from two individual experiments.
(I) Kaplan-Meyer curve showing percent survival of mice injected with allogeneic BM and 32D-MPL-CALRdel52 cells. Mice received 2x10⁵ allogeneic T cells (Tc) on day 2 post allo-HCT and were treated with anti-TGFβ1,2,3 neutralizing antibody or respective isotype control on day 12, 16 and 20 post allo-HCT, as indicated. Pooled data from two individual experiments.
(J) Kaplan-Meyer curve showing percent survival of mice injected with 32D-KRASG12V cells and allogeneic BM. Mice received 2x10⁵ allogeneic T cells (Tc) on day 2 post allo-HCT and were treated with anti-TGFβ1,2,3 neutralizing antibody or respective isotype control on day 12, 16 and 20 post allo-HCT, as indicated. Data from one experiment is shown.
(K) Kaplan-Meyer curve showing percent survival of mice injected with BaF3-FLT3ITD cells and allogeneic BM. Mice received 200.000 allogeneic T cells (Tc) on day 2 post allo-HCT and were treated with anti-TGFβ1,2,3 neutralizing antibody or respective isotype control on day 12, 16 and 20 post allo-HCT, as indicated. Data from one experiment is shown.
P values were calculated using Mantel-Cox Test (A, H-K) or ordinary one-way ANOVA (B-G). Bar plots show mean at SEM.

