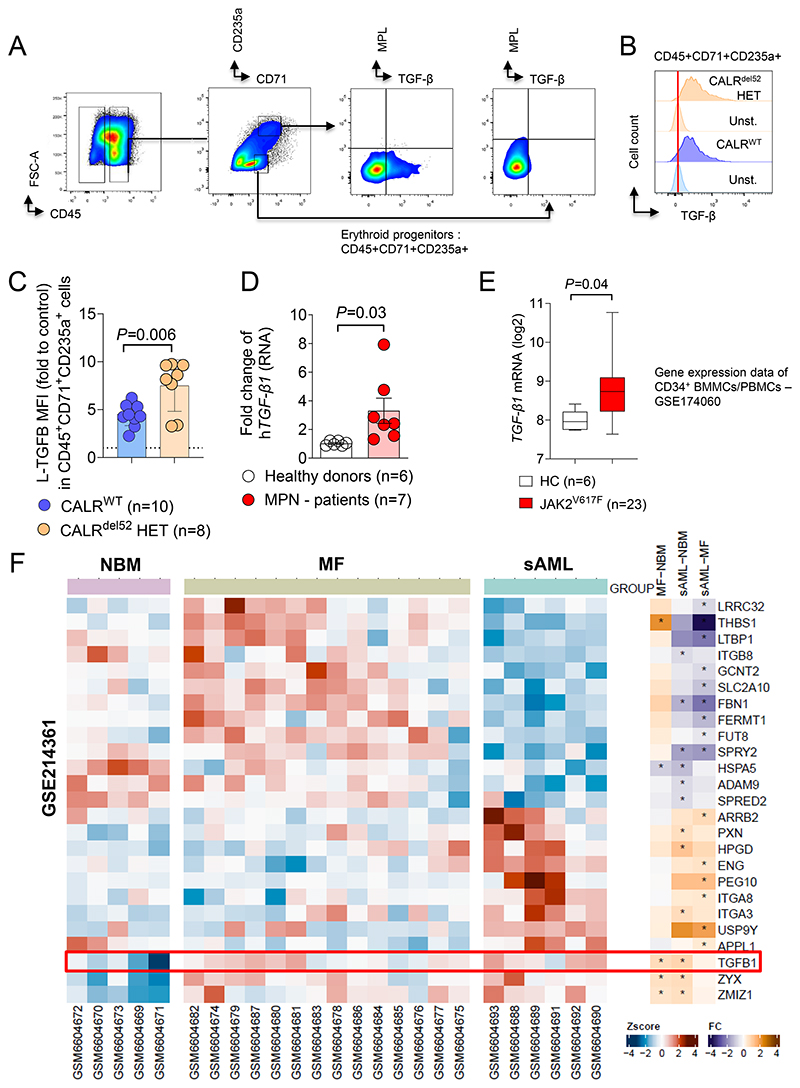
Figure 7. TGF-β1 expression is increased in patient derived MPN samples.
(A) Gating strategy for TGF-β and MPL quantification on CALRdel52 or CALRWT iPSC-derived erythroid progenitor cells CD45+CD71+CD235a+/-.
(B) Representative histogram plot showing TGF-β expression on the surface of CALRdel52 or CALRWT iPSC-derived CD45+CD71+CD235+ erythroid progenitors with respective unstained control.
(C) Scatter plot showing relative MFI of L-TGF-β surface expression on CALRWT or CALRDEL52 iPSC-derived CD45+CD71+CD235a+ erythroid progenitor cells, fold change to MFI of unstained control. CALRDEL52 iPSC and CRISPR repaired CALRWT control were generated from one CALRdel52 MPN patient. Each dot represents individual experiment. The P-value was calculated using unpaired Student´s t test.
(D) Scatter plot showing fold change RNA expression of human TGF-β1 in total mononuclear BM cells from MPN patients or healthy donors from the Freiburg MPN cohort.
(E) Box plot showing TGF-β1 RNA expression (log2) in CD34+BMMCs/PBMCs from publicly available data set (GSE174060 - (42)).
(F) Heat map showing expression profiling by GeneChipHuman Gene 2.0 ST Arrays (Affymetrix) of Lin-CD34+ PBMCs of normal bone marrow donors (NBM), patients with primary myelofibrosis (MF) and secondary AML (sAML). Data were obtained and re-analyzed from Gene Expression Omnibus (GEO) Database - GSE214361 (43). A set of genes involved in TGF-β1 regulation and activation was selected. Z score for separate patients is shown on the left and fold change comparing each group is shown on the right (* indicates significant changes).

