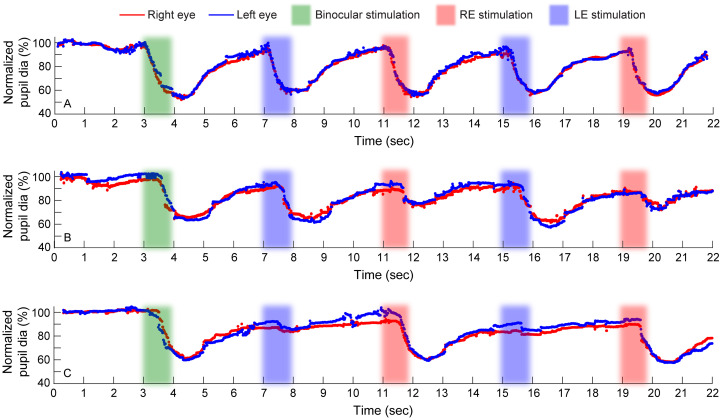
Figure 1.
Raw traces of normalized pupillary diameters of the right and left eyes plotted as a function of time for a representative control (A), a case with right eye RAPD (B) and another case with left eye RAPD (C). Data from two of the three cycles of light stimulation are shown here. The raw traces are plotted as percentage change in the pupil constriction relative to the baseline dark-adapted state. Stimulation of both eyes at the beginning of the trial and stimulation of the right and left eyes independently are indicated by differently colored bands. The time epoch before the green band represents the dark adaptation provided to the subject.

