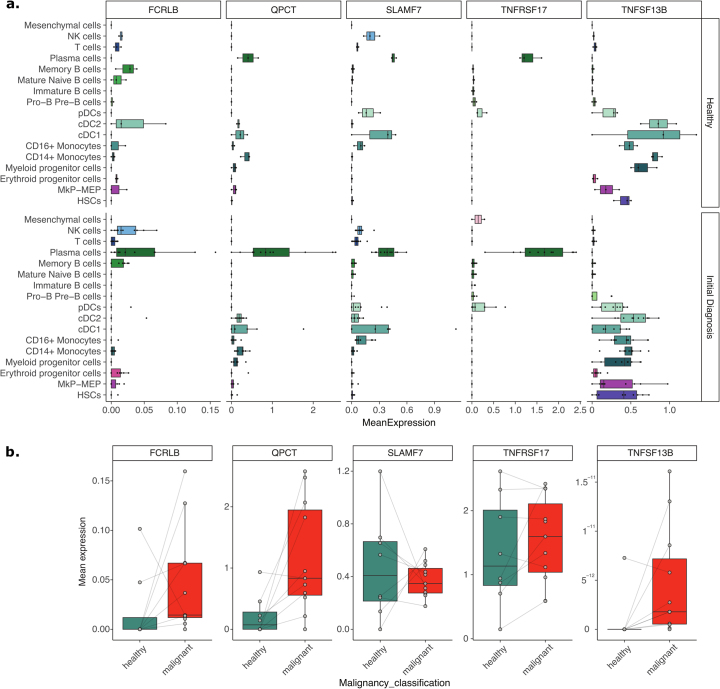
Extended Data Fig. 6. Gene expression levels of predictor proteins between healthy and malignant state and cells in the bone marrow immune environment of multiple myeloma (MM) patients.
a, Mean gene expression levels of predictor proteins within the BM split by cell type and clinical state (healthy, initital diagnosis). b, Box plots illustrating mean gene expression of predictor proteins within healthy versus malignant plasma cells of MM patients at initial diagnosis as characterized by inferCNV. Data are presented as median values; box edges are 1st and 3rd quartiles; and whiskers represent 1.5× interquartile range (N healthy = 8, N malignant = 11).

