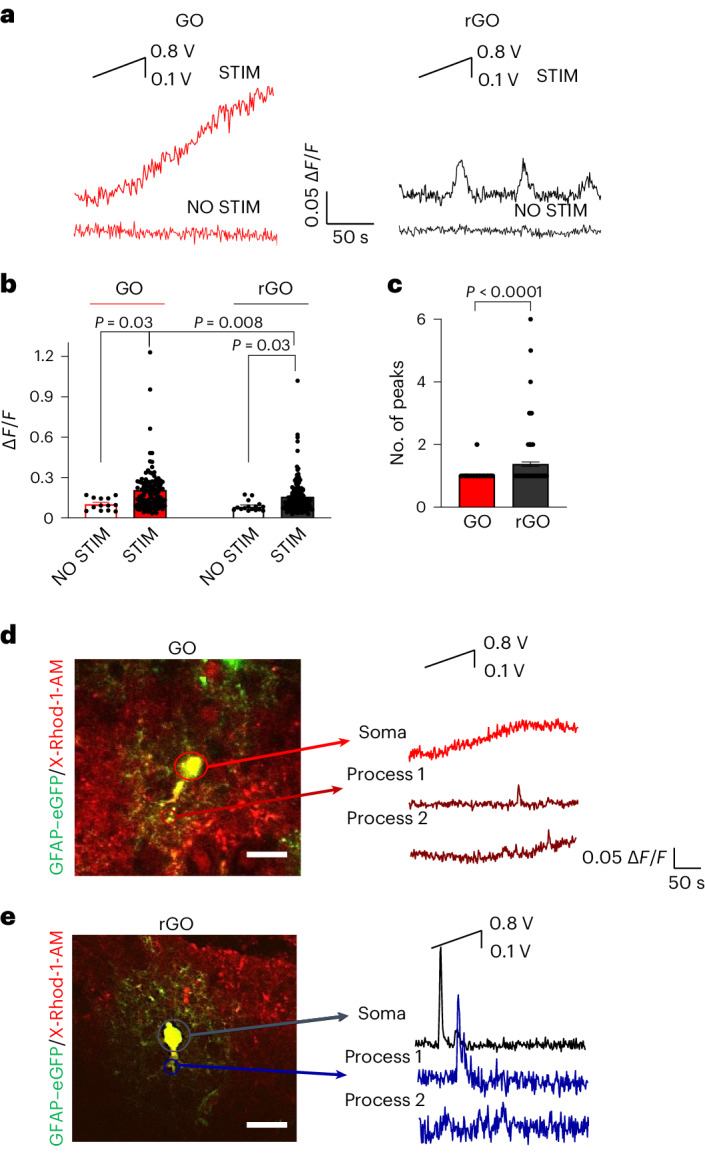
Fig. 4. Electrical stimulation by GO/rGO elicits S-type and P-type Ca2+ signalling in astrocytic soma and process in brain slices.

a, Representative traces of Ca2+ imaging experiments performed on brain slices lying on GO (left) and rGO devices (right), using the same voltage protocol as described before (inset). b,c, Bar–dot graphs of maximal averaged fluorescence variation (ΔF/F, b) and number of peaks (c), measured on GO and rGO devices. Data are presented as mean ± s.e.m. For GO, N = 6, s = 13, n = 108, ΔF/F = 0.20 ± 0.02, no. of peaks = 1.02 ± 0.01. For rGO, N = 4, s = 9, n = 142, ΔF/F = 0.16 ± 0.01, no. of peaks = 1.37 ± 0.07. For GO NO STIM, N = 2, s = 2, n = 13, ΔF/F = 0.10 ± 0.01. For rGO NO STIM, N = 2, s = 2, n = 16, ΔF/F = 0.09 ± 0.01. n, number of analysed cells; s, number of slices. Statistical significance was calculated via one-way ANOVA with Bonferroni post-test. P values are reported in the graph when P ≤ 0.05, which was considered significant. d,e, Representative traces of [Ca2+]i over time (right) performed with high magnification on X-Rhod-1/GFAP–eGFP-labelled astrocytes (merged images, left) for slices on GO (d) and on rGO (e), analysed in astrocytic soma and in astrocytic processes.
