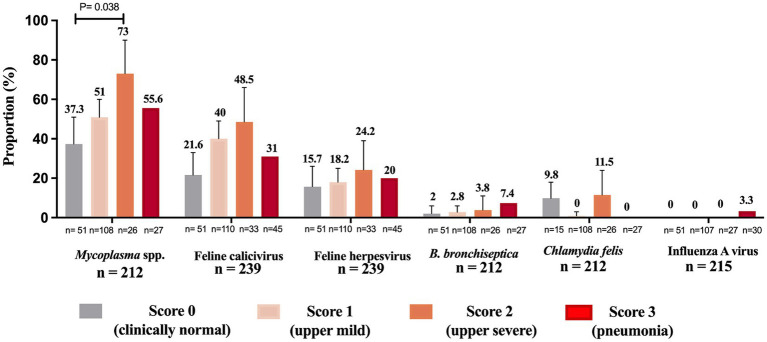
Figure 4.
Proportion of feline respiratory pathogens by clinical presentation. Cats were categorized into four clinical score groups: score 0 (clinically normal cats), score 1 upper mild (coughing, sneezing, conjunctivitis, or nasal/eye discharge), score 2 upper severe (coughing, sneezing, conjunctivitis, nasal/eye discharge, in addition to ulcers in the mouth, lethargy, depression, inappetence or fever) and score 3 (pneumonia followed by one or more signs such as dyspnea, lethargy, depression, inappetence or fever). “n” denotes the total counts of positive and negative instances for each pathogen within each clinical score group. The sum of the proportions of cats within each clinical score group across all pathogens may not equal 100%, as a cat can test positive for multiple pathogens or negative for all pathogens, and the presence of one pathogen does not exclude the presence of others. Total n = total number of cats containing a description of clinical signs on the sample submission forms. Data were analyzed using Holm’s post-hoc test after Fisher’s exact test and p-values ≤ 0.05 were considered significant. Error bars represent 95% confidence intervals.

