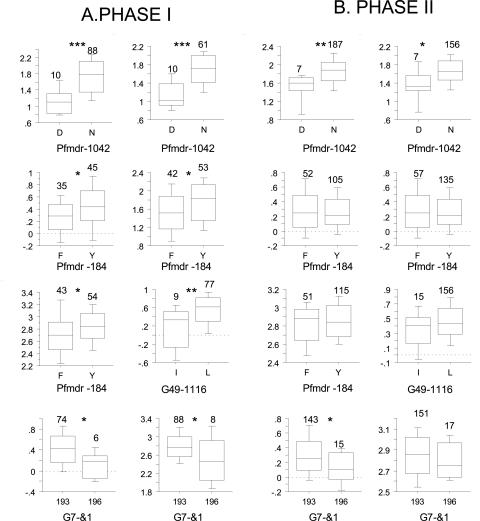
FIG. 1.
(A) Box-and-whisker plots showing associations between polymorphisms and drug response in phase I samples. (B) The same associations examined in phase II samples. Asterisks above graphs indicate significance level (*, P < 0.05; **, P < 0.01; ***, P < 0.001). The boxes indicate the 25th and 75th percentiles, the whiskers indicate the 10th and 90th percentiles, and the lines show the median values. The numbers at the top of each graph indicate the sample sizes for each of the alternate states at the polymorphism examined. Only the pfmdr-1042 and G7 polymorphisms remain significantly associated with drug response in both phase I and II population samples examined.

