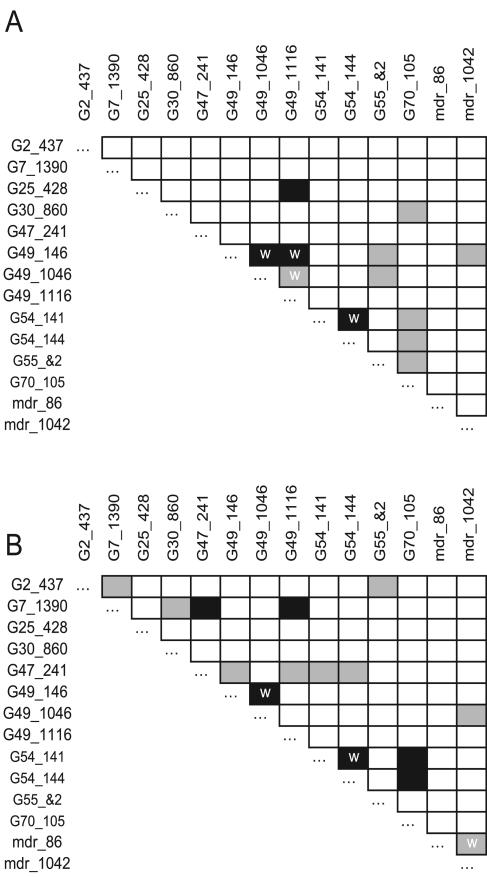
FIG. 3.
Linkage disequilibrium between 15 polymorphic markers (SNPs or microsatellites) in 10 transporter genes. Panel A shows results from this study. Panel B shows results from Mu et al.'s Southeast Asian data set for comparison (14). Significance was assessed by permutation as described in the text (black shading, P < 0.01; grey shading, P < 0.05). Significant comparisons between markers located within the same gene are marked with a white “w” to distinguish them from between-gene comparisons.

