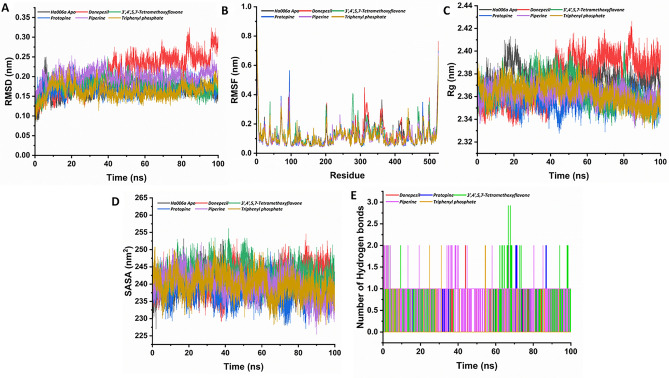
Figure 4.
The structural stability of both the apo Ha006a and its complexes throughout the molecular dynamic simulation run of 100 ns is depicted through graphical representations. The (A) Root Mean Square Deviation (RMSD), (B) Root Mean Square Fluctuation (RMSF), (C) Radius of Gyration (Rg), (D) Solvent Accessible Surface Area (SASA), and (E) Hydrogen Bond analysis of 100 ns trajectories of apo Ha006a and Ha006a-ligand complexes are displayed. The graphs illustrate the behavior of the apo protein (black) and its complexes with donepezil (red), protopine (blue), 3′,4′,5,7-tetramethoxyflavone (green), piperine (purple), and triphenyl phosphate (light brown).

