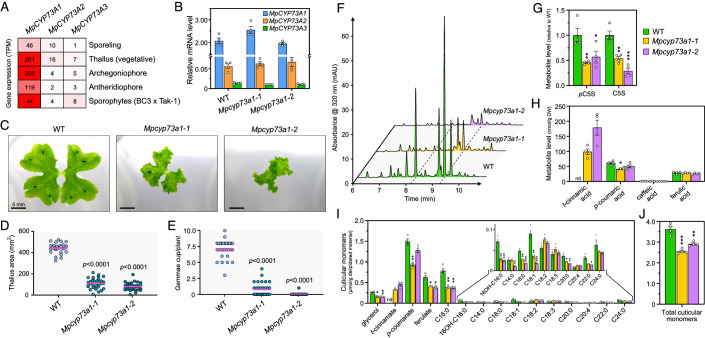
Figure 5. Developmental and metabolic consequences of CYP73A1 deficiency in M. polymorpha.
(A) Expression profiles of the three M. polymorpha CYP73 paralogs in various tissues. Data are derived from the CoNekT database (https://evorepro.sbs.ntu.edu.sg; Proost and Mutwil, 2018), except sporophytes for which data derive from the MarpolBase database (https://marchantia.info/mbex/). (B) RT-qPCR expression analysis of the three MpCYP73 genes in 3-week-old wild-type, Mpcyp73a1-1 and Mpcyp73a1-2 plants. Results are the mean ± SEM of four biological replicates. (C) Representative pictures of 3-week-old wild-type, Mpcyp73a1-1 and Mpcyp73a1-2 plants. (D, E) Quantification of thallus area (D) and gemmae cup number (E) in 3-week-old wild-type, Mpcyp73a1-1 and Mpcyp73a1-2 plants. Results are the mean (pink trait) of measurements made on 29–32 plants. WT versus mutant one-way ANOVA adjusted P-value is displayed. (F) Representative UHPLC-UV chromatograms of 1-month-old wild-type, Mpcyp73a1-1 and Mpcyp73a1-2 crude extracts. (G) Relative quantification of shikimate phenolic esters in 1-month-old wild-type, Mpcyp73a1-1 and Mpcyp73a1-2 plants. C5S, caffeoyl-5-O-shikimate; pC5S, p-coumaroyl-5-O-shikimate. (H) Quantification of hydroxycinnamic acids from saponified extracts of 1-month-old wild-type, Mpcyp73a1-1 and Mpcyp73a1-2 plants. (I) Compositional analysis of the cuticular polymer in 1-month-old wild-type, Mpcyp73a1-1 and Mpcyp73a1-2 plants. (J) Total amount of cuticular monomers in 1-month-old wild-type, Mpcyp73a1-1 and Mpcyp73a1-2 plants. Results in panels (G), (H), (I), and (J) are the mean ± SEM of four independent biological replicates for each genotype. WT versus mutant unpaired t test adjusted P-value: *P < 0.05; **P < 0.01; ***P < 0.001. nd, not detected. Source data are available online for this figure.

