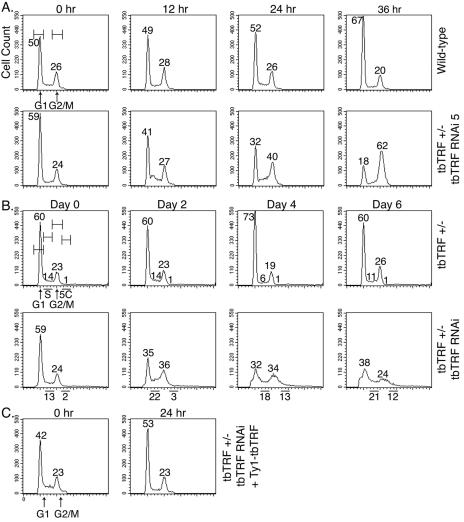
FIG. 6.
tbTRF RNAi leads to cell cycle arrest. Cells were fixed at the indicated times after tbTRF RNAi induction and stained with propidium iodide for FACS analysis. (A) Bloodstream wild-type cells or clone 5 of tbTRF+/− tbTRF-RNAi cells were analyzed. G1 and G2/M peaks and gates are marked in the first panel. The percentage of cells in these two phases among the population is indicated next to each peak. (B) Procyclic tbTRF+/− or tbTRF+/− tbTRF-RNAi cells were analyzed. G1 and G2/M peaks plus S phase and cells with 5C content were marked in the first panel. “5C” is used to represent cells with DNA contents equivalent to five copies of haploid DNA. The percentages of cells that are in each phase among the population are indicated. (C) Ectopic Ty1-tbTRF expression complemented the tbTRF RNAi growth arrest phenotype. FACS analysis of bloodstream tbTRF+/− tbTRF-RNAi cells that also carry an ectopic Tet-inducible Ty1-tbTRF is shown.

