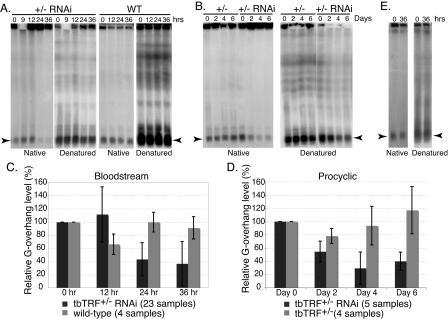
FIG. 7.
Telomere G-overhang signal is reduced by tbTRF RNAi. DNA plugs were prepared from cells at indicated hours (A and E) or days (B) after tbTRF RNAi induction. Intact chromosomal DNA was separated by RAGE, and the dried gel was hybridized with the end-labeled (CCCTAA)4 either before or after denaturation as indicated. (A) DNA plugs were prepared from bloodstream wild-type (WT) or tbTRF+/− tbTRF-RNAi cells. (B) DNA plugs were prepared from procyclic tbTRF+/− or tbTRF+/− tbTRF-RNAi cells. (C and D) Quantified telomere G-overhang level changes in bloodstream (C) and procyclic (D) tbTRF+/− tbTRF-RNAi cells. The telomere G-overhang levels at different time points after tbTRF RNAi induction were normalized to those at the zero time point. The averages of relative telomere G-overhang level (the G-overhang signal at any time/the G-overhang signal at zero time) ± standard deviations are shown for wild-type cells (light grey bars in panel C), tbTRF+/− cells (light grey bars in panel D), or tbTRF+/− tbTRF-RNAi cells (dark grey bars in panels C and D). The numbers of samples included in each calculation are indicated at the bottom of each panel. (E) DNA plugs were prepared from bloodstream tbTRF+/− tbTRF-RNAi cells with an ectopic Ty1-tbTRF. In panels A, B, and E, arrowheads indicate the signals from minichromosomes.

