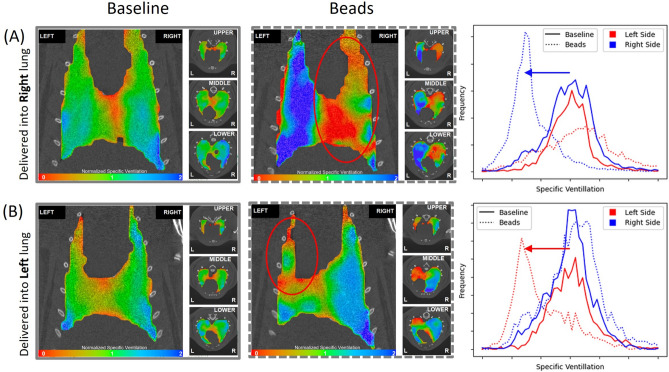
Fig. 5.
Visualisation of changes in local ventilation, and frequency distribution of specific ventilation, after agar bead delivery to the lung. (A) The top row shows a rat that received agar beads to the right lung, and (B) the bottom row shows a rat that received an agar bead delivery to the left lung. Left panel (pre-beads) and middle panel (post-beads): A single mid-coronal slice and three axial slices (upper, middle and lower), showing normalised specific ventilation at peak inspiration. Green indicates average ventilation, red below average ventilation, and blue above average ventilation. Red circle indicates the side beads were delivered to. Right panel: Average histograms of mean specific ventilation in right (blue) and left (red) lungs pre- (solid line) and post-bead (dot line) delivery in rats.

