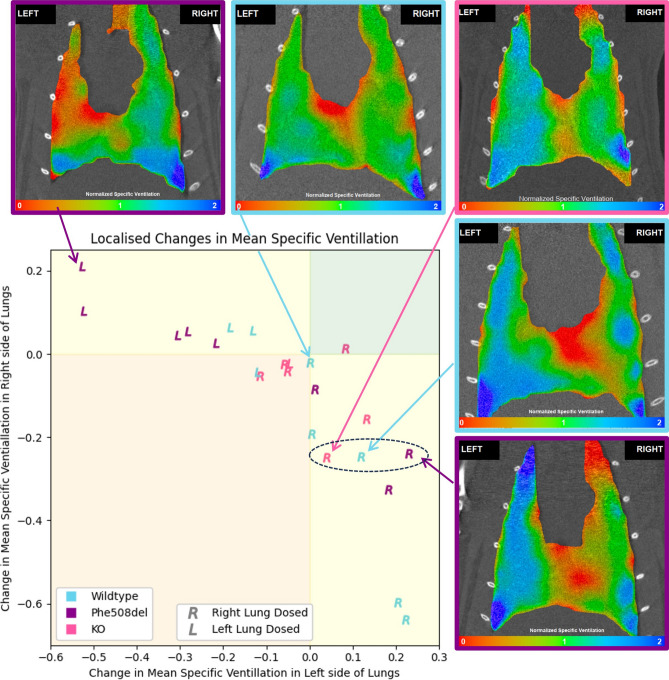
Fig. 6.
Localised changes in ventilation can be visualised and quantified. A single mid-coronal slice from different rats showing different areas of ventilation depending on where the bead delivery occurred. Red zones indicate below average ventilation, blue above average ventilation, and green average ventilation. Each rat is marked with the letter L or R to indicate which lung received the bead dose and is coloured by genotype. These five rats were selected to show the different maps that result from animals in different locations on the plane.

