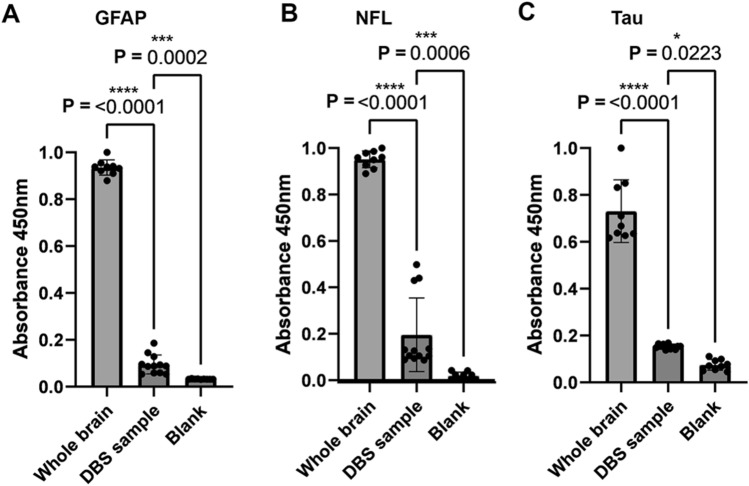
Fig. 4.
ELISA analysis of neuronal and glial proteins. (A) Normalized absorbance values for GFAP detection from PD DBS (n = 4), LBD cingulate whole brain lysate (n = 3), and blank solution all in triplicate. Comparison using T-test and associated P value are displayed. (B) Normalized absorbance values for NFL detection from PD DBS (n = 4), LBD cingulate whole brain lysate (n = 3), and blank solution all in triplicate. Comparison using T-test and associated P value are displayed. (C) Normalized absorbance values for tau detection from PD DBS (n = 4), LBD cingulate whole brain lysate (n = 3), and blank solution (n = 3), all in triplicate. Comparison using T-test and associated P value are displayed.

