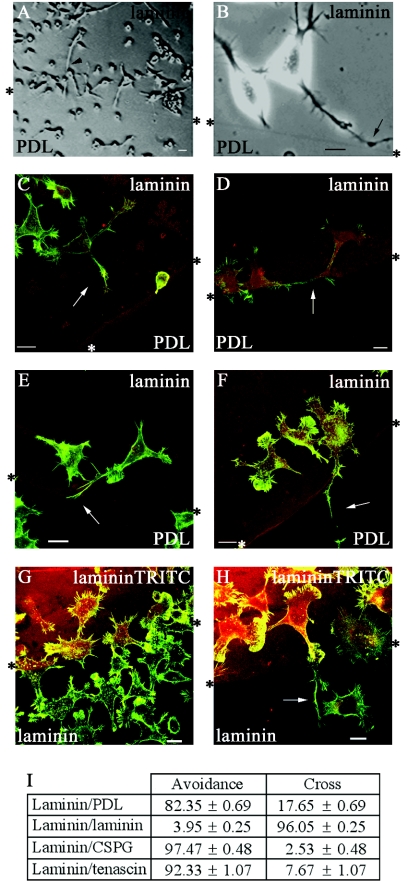
FIG. 1.
N1E-115 neuroblastoma cells are responsive to signaling differences at a boundary. (A and B) Phase-contrast images of serum-starved cells at a laminin/PDL boundary. (A) Cells accumulated on the laminin side of the boundary and at the boundary have shorter neurites than those further away. (B) Neurite has begun to turn away from PDL (arrow), avoiding crossing from laminin. *, boundary interface. (C to F) Fixed cells were stained with phalloidin (green) and laminin premixed with TRITC (red) to visualize the boundary interface. (C) Cell with shortened neurite (arrow) at laminin/PDL boundary—Stop category (D) Cell with neurite changing direction (arrow) at laminin/PDL boundary—Turn category. (E.) Cell with neurite containing long filopodia at its distal end (arrow), splaying out with a sidestepping morphology to avoid crossing PDL—Turn category. (F) Cell with neurite that has crossed (arrow) from laminin onto PDL—Cross category. (G and H) Cells at laminin-laminin-TRITC boundary remain in sharp focus, suggesting that laminin is not causing a ridge. In panel H a neurite that has crossed is indicated by an arrow. Cells were stained with phalloidin (green), and a secondary coat of laminin was mixed with TRITC dye (red). Scale bar = 20 μm in these and all subsequent figures. (I) Analysis of neurites that avoid crossing or cross the boundary between laminin and another substrate. The results are for three independent experiments (n = 6; 6 coverslips containing one boundary each) in all experiments except for laminin-laminin-TRITC, wheren = 10. Standard errors of the means are shown here and in subsequent figures. For each condition in this and subsequent figures, the numbers of cells analyzed were from 139 to 1,310, with the average number being 530 cells.

