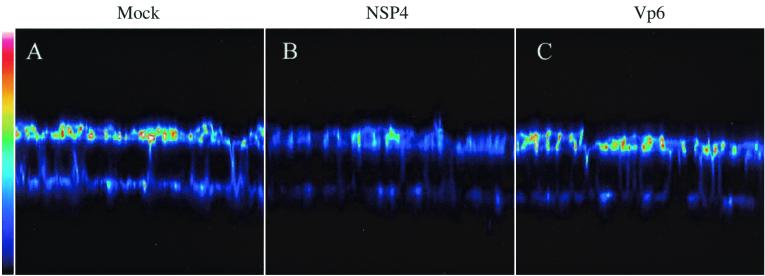
FIG. 6.
NSP4 perturbs F-actin distribution in polarized MDCK-1 cells. Shown is a vertical section (x-z) of mock-treated MDCK-1 cells (A) or MDCK-1 cells treated for 24 h with 1 nmol of NSP4 (B) or 1 nmol of VP6 (C). F-actin was identified by TRITC-labeled phalloidin and analyzed by confocal microscopy. The vertical sections were scanned with a 0.35 pixel size and a pinhole setting of 50 μm. The pseudocolors in the images represent the relative concentration (linear 8-bit scale) of F-actin. White shows the maximum intensity (level 256) and dark blue shows the minimum intensity (level 0).

