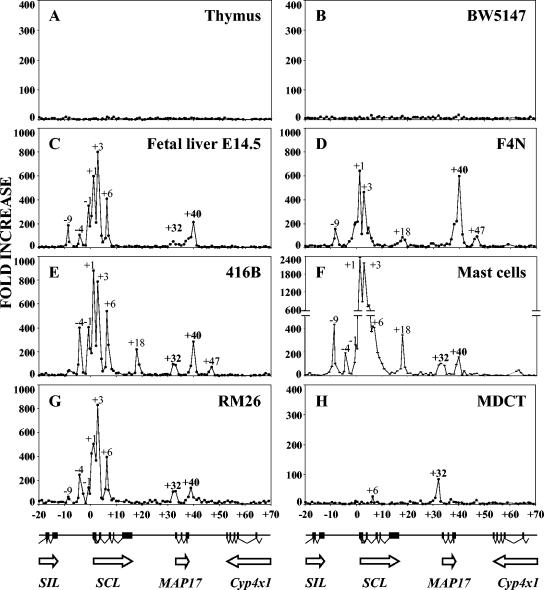
FIG. 2.
Chromatin immunoprecipitation of acetylated histone H3 throughout the murine SCL locus. A diagram of the murine SCL locus is shown beneath each set of four panels. Quantitative PCR was performed using primers located approximately every 1 kb throughout a 90-kb region. The increase over background was calculated by comparison with immunoprecipitates obtained using rabbit IgG. Peaks of H3 acetylation are labeled according to their positions relative to the first nucleotide of SCL exon la. (A) Adult mouse thymus; (B) BW5147 T-cell line; (C) embryonic day 14.5 fetal liver; (D) F4N erythroid cell line; (E) 416B myeloid progenitor cell line; (F) adult spleen mast cells; (G) RM26 myeloid cell line; (H) MDCT kidney cell line.

