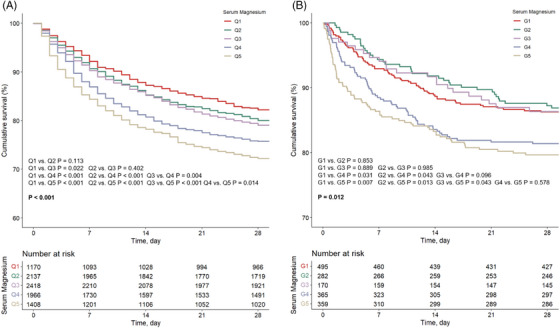
FIGURE 2.

(A, B) Kaplan–Meier survival analysis curves of the two cohorts. Kaplan–Meier curves showing the cumulative probability of all‐cause mortality according to groups within 28 days for the Medical Information Mart for Intensive Care‐IV (MIMIC‐IV) cohort (A) and the institutional cohort (B).
