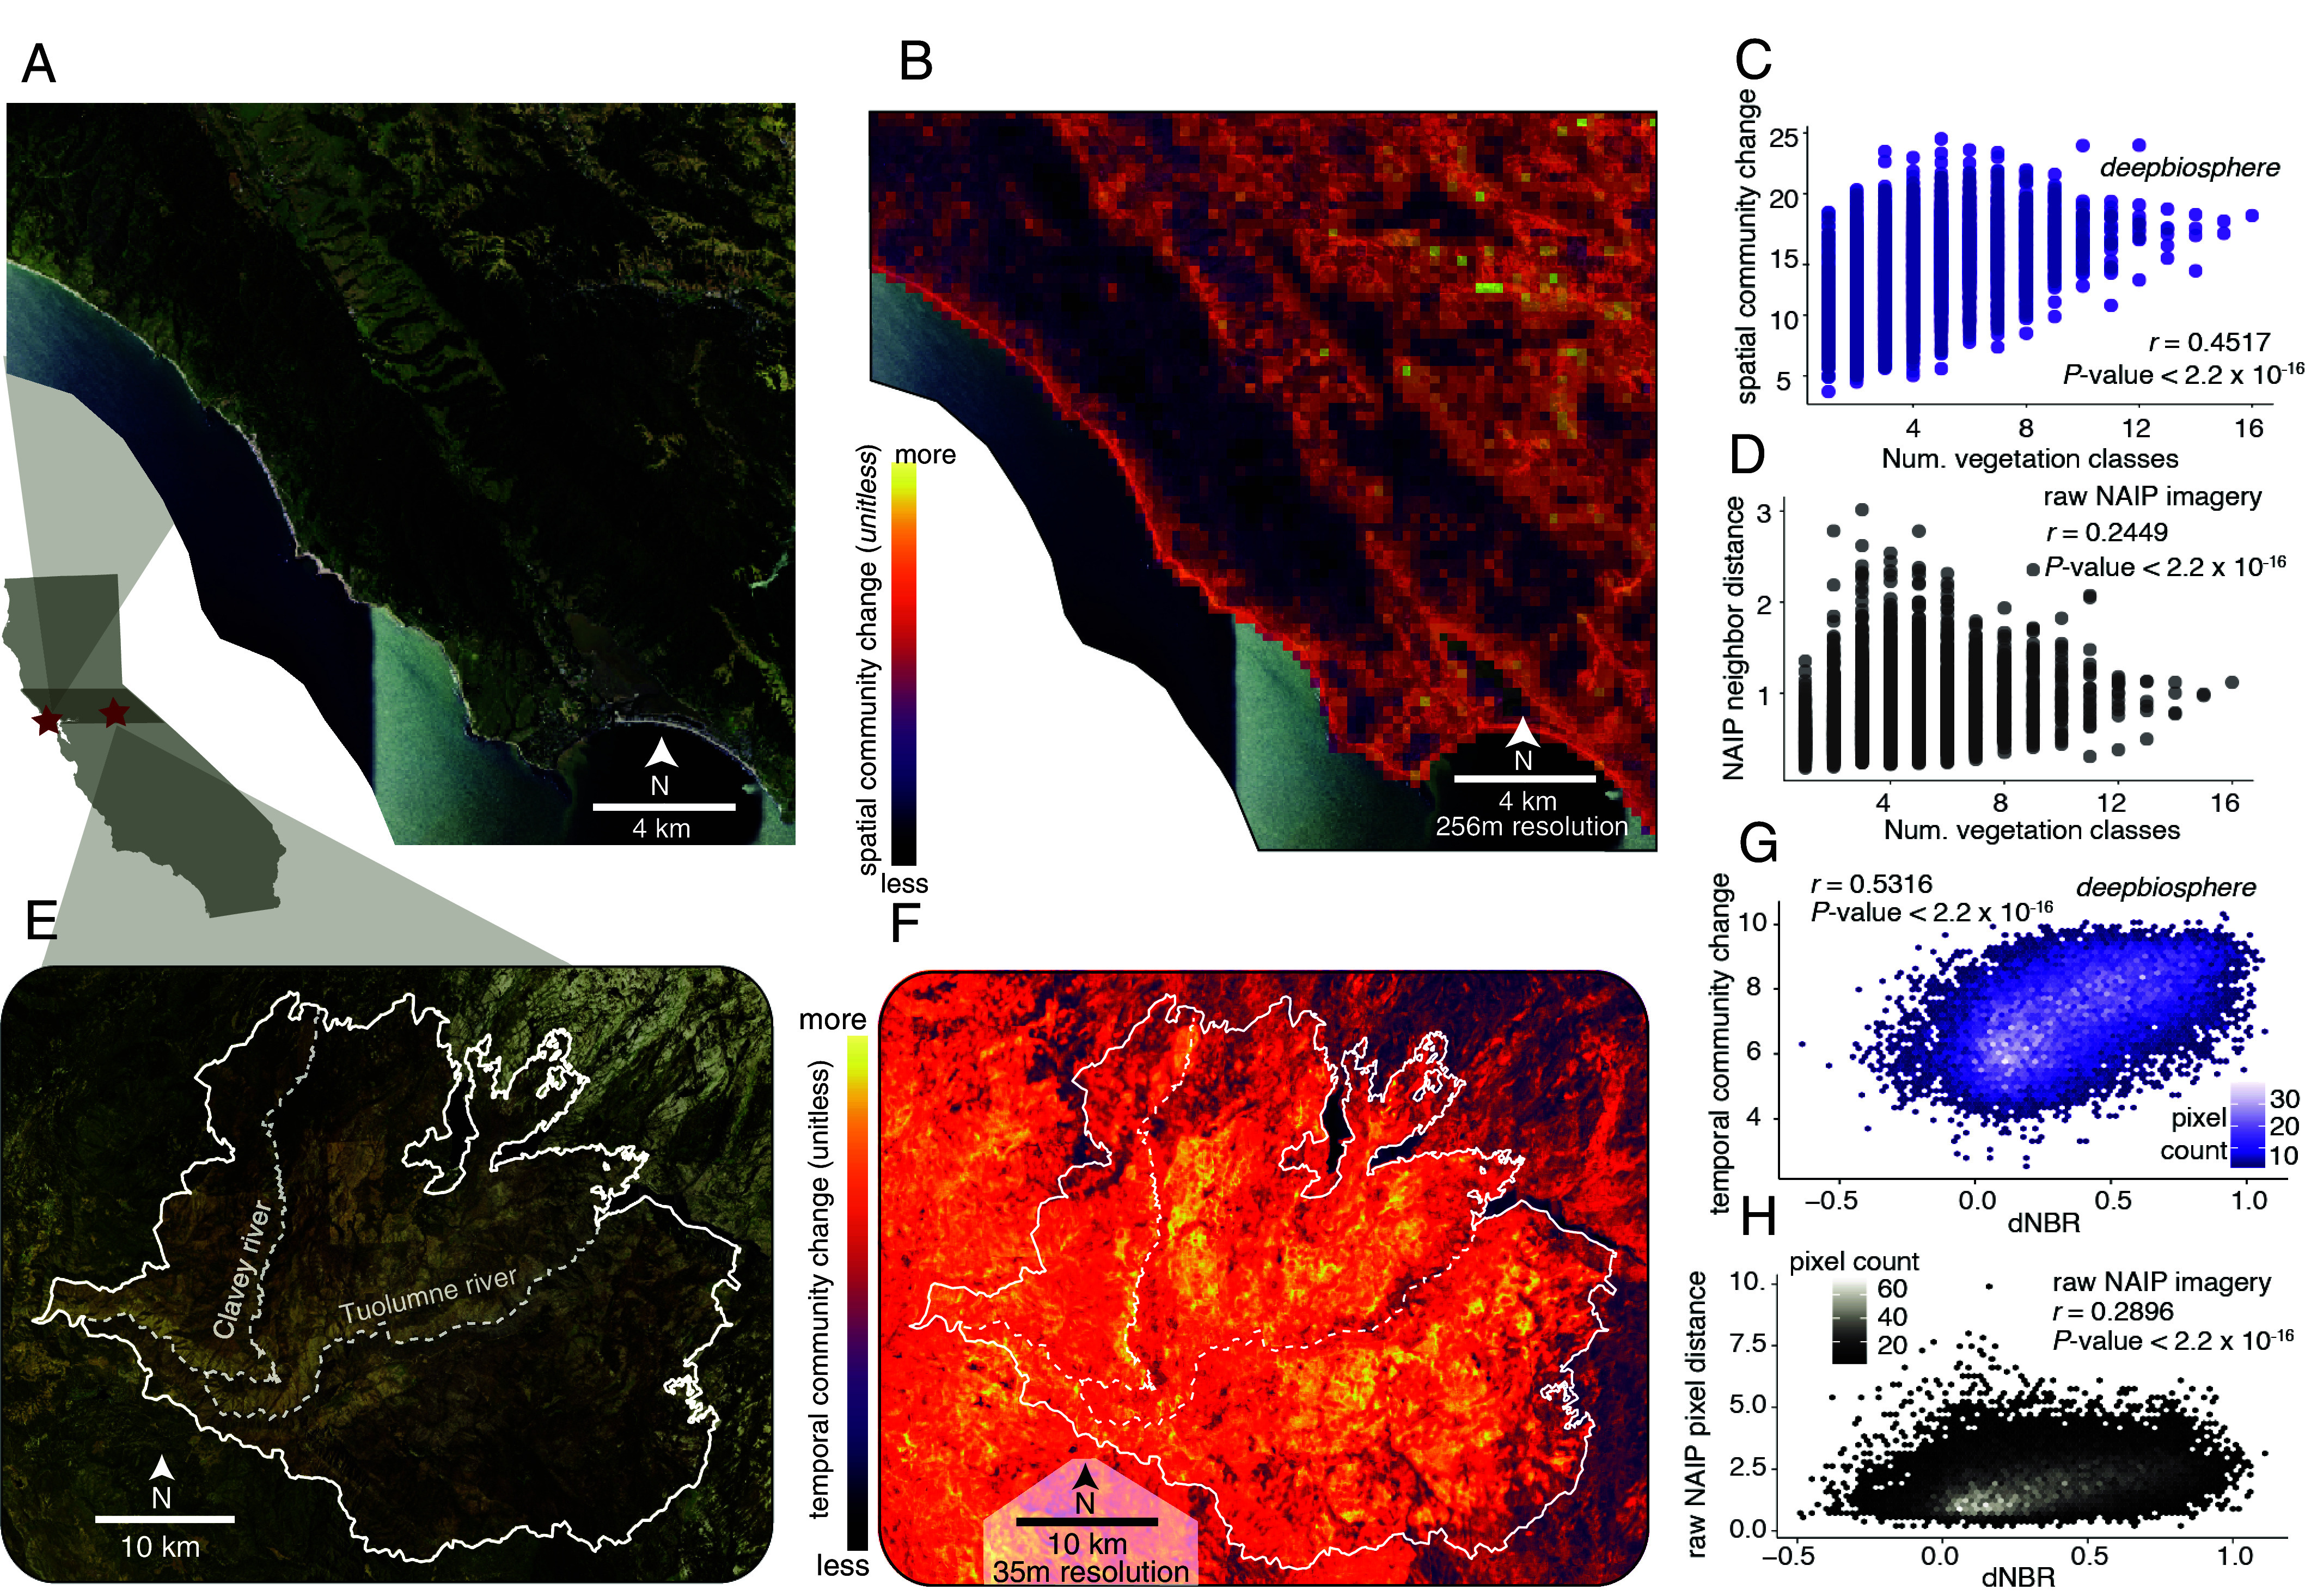
Fig. 3.

Detection of high-resolution spatial and temporal community change using Deepbiosphere. (A) NAIP aerial imagery of northern Marin county (16). Marin county has substantial habitat fragmentation and sits between two major ecoregions, the coast range and oak chaparral. (B) Deepbiosphere’s spatial community change calculated using an edge-detection algorithm applied to the predicted presence of all 2,221 plant species (SI Appendix, SM 5.1 and Fig. S19). (C) Comparison of the number of unique fine-scale vegetation types (20) present in each 256 × 256 m plot and Deepbiosphere’s spatial community change predictions. (D) Comparison of the number of unique fine-scale vegetation types (20) present at each 256 × 256 m plot and an edge-detection algorithm run on raw NAIP RGB-I images. (E) 2014 NAIP aerial imagery (16) of Sierra foothills after severe Rim Fire of 2013 (fire boundary in white). (F) Deepbiosphere’s temporal community change metric, calculated using the Euclidean distance between predicted species presence in 2012 and 2014 (SI Appendix, SM 5.2 and Fig S21). (G) Comparison of an empirical burn severity metric—difference in normalized burn ratio (dNBR, SI Appendix, Fig. S20C) (21)—with Deepbiosphere’s temporal community change from f. (H) Comparison of dNBR with the Euclidean distance calculated between raw NAIP RGBI-I imagery from 2012 and 2014 (16) (SI Appendix, Fig. S20E).
