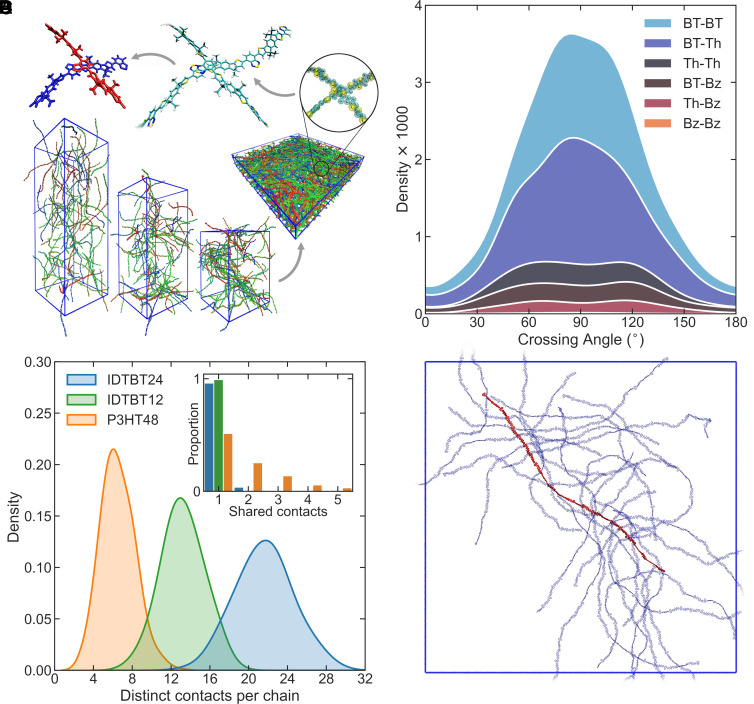
Fig. 2.
Arrangement of C16-IDTBT chains in the solid state. (A) Counterclockwise from Bottom: Snapshots of MD procedure replicating drying of a thin film. An arrow points toward the finished dry film. Chains are given randomized colors, and solvent molecules and side chains are hidden, for clarity. A zoomed-in view of a pair of coarse-grained chains is shown. An arrow points from there to a view of the same chains after backmapping. Another arrow shows the extraction of 2mer segments closest to contact point. Side chains are shortened to methyl groups as part of the final step but are hidden or shortened across all steps for clarity. (B) Stacked distributions of crossing angles for all interchain close contacts extracted from the C16-IDTBT 24mer system. Colors represent which moieties are in closest contact between the two backbones. Areas of colored regions represent occurrence of different moieties at the closest point of contact, with larger areas indicating more contacts of this type. (C) Distributions of the number of contacts to distinct chains made by each chain belonging to the different CP systems. The Inset shows how many contacts tend to be shared between chain pairs with at least one contact. (D) A visual depiction of the interconnectivity of the C16-IDTBT 24mer system. A single chain backbone is shown in red, with all chain backbones in close contact with this primary chain in semitransparent blue. The simulation bounding box is shown as a blue square.

