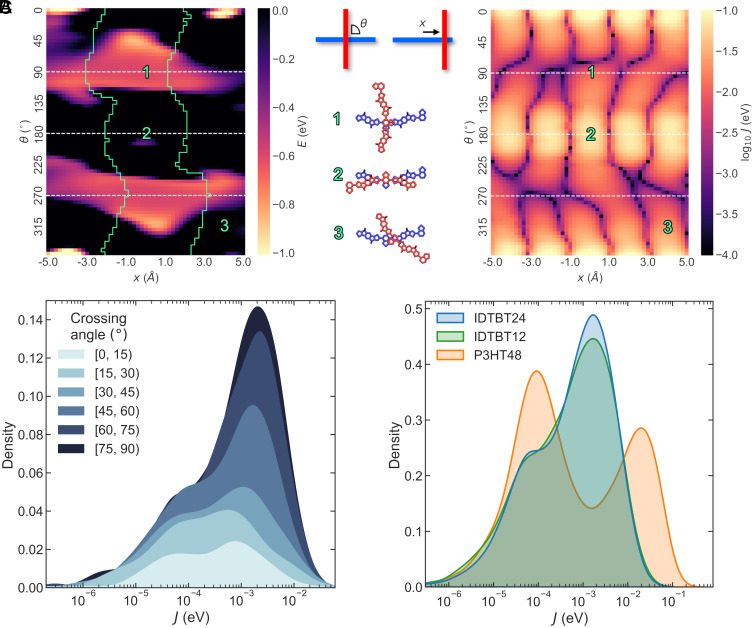
Fig. 3.
Interactions between chains. (A) Heatmaps displaying the enthalpic interaction energies, E, (Left) and hole transfer integrals, J, (Right) between a pair of IDTBT 2mer segments. Each pixel on the heatmaps represents a different arrangement, with the upper chain being shifted by x in the backbone direction of the lower chain and rotated by θ around its central BT unit. An explanatory diagram is shown between the heatmaps. Below are shown example arrangements, corresponding to marked locations on the heatmaps. White dashed lines represent parallel and perpendicular arrangements. The green lines on the energy heatmap mark the boundary between BT–BT contact (inside the green lines) and BT–Th contact (outside the green lines). Note that small areas where other moieties are in closest contact have been neglected. A detailed map of contact moieties can be seen in SI Appendix, Fig. S26. (B) Distribution of J for contacts extracted from the C16-IDTBT 24mer thin film model. Distributions are binned according to the crossing angle between backbones. (C) Distributions of J for contacts extracted from C16-IDTBT 24mer, C16-IDTBT 12mer, and P3HT 48mer models.

